News
Stay up to date on the latest crypto trends with our expert, in-depth coverage.
In August, the US CPI rose by 0.4% month-on-month and increased to 2.9% year-on-year, with housing and food being the main drivers. Inflationary pressure is intensifying again. The full report is as follows.

Don't let those "tin cans" control you or take away your tokens.

Airdrops can't provide stability, but work can.


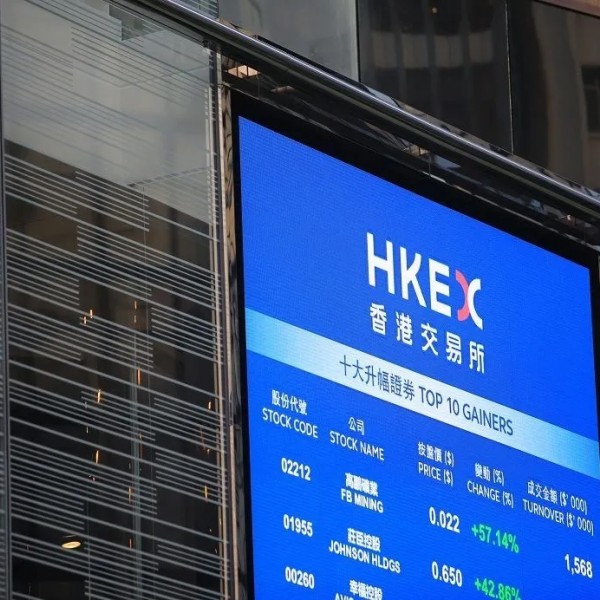
When RWA and stablecoins become mainstream and the dual-yield model is accepted by more investors, the attractiveness of Hong Kong stocks will be systematically enhanced.

Dr. Lam Ka-lee's call and xBrokers' practices serve as meaningful mutual validation: proactive policy actions, combined with effective platform mechanisms, are essential for RWA to truly play a role in the Hong Kong stock ecosystem.
- 16:17IMF: The Federal Reserve has room to begin gradually lowering interest rates, but should proceed with cautionJinse Finance reported that the International Monetary Fund (IMF) stated that the Federal Reserve has room to begin gradually lowering interest rates, but should proceed cautiously. There are some upside risks to U.S. inflation, largely due to tariffs.
- 16:07Today, US Bitcoin ETF net inflow is 6,324 BTC, and Ethereum ETF net inflow is 32,292 ETH.ChainCatcher News, according to monitoring by Lookonchain, the net inflow of 10 US Bitcoin ETFs was 6,324 BTC, of which Fidelity saw an inflow of 2,638 BTC and currently holds 203,206 BTC; the net inflow of 9 Ethereum ETFs was 32,292 ETH, with BlackRock seeing an inflow of 17,243 ETH and currently holding 3,688,553 ETH.
- 16:07If Ethereum breaks through $4,550, the cumulative short liquidation intensity on major CEXs will reach $1.59 billions.ChainCatcher news, according to Coinglass data, if Ethereum breaks through $4,550, the cumulative short liquidation intensity on major CEXs will reach 1.59 billions. Conversely, if Ethereum falls below $4,350, the cumulative long liquidation intensity on major CEXs will reach 1.014 billions. Note: The liquidation chart does not display the exact number of contracts to be liquidated or the precise value of contracts being liquidated. The bars on the liquidation chart actually show the relative importance, or intensity, of each liquidation cluster compared to adjacent clusters. Therefore, the chart demonstrates the extent to which the underlying price reaching a certain level will be affected. A higher "liquidation bar" indicates that when the price reaches that level, there will be a stronger reaction due to a wave of liquidity. .