Bitcoin ( BTC ) is due for a “parabolic” reaction as a classic volatility indicator plumbs new all-time lows.
Key points:
Bitcoin’s Bollinger BandWidth indicator offers hope of a 2023-style BTC price surge into year-end.
BandWidth avoided a “red” event despite the recent BTC price drawdown.
Traders demand more proof of an enduring market rebound.
Bitcoin Bollinger BandWidth preps “parabolic leg up”
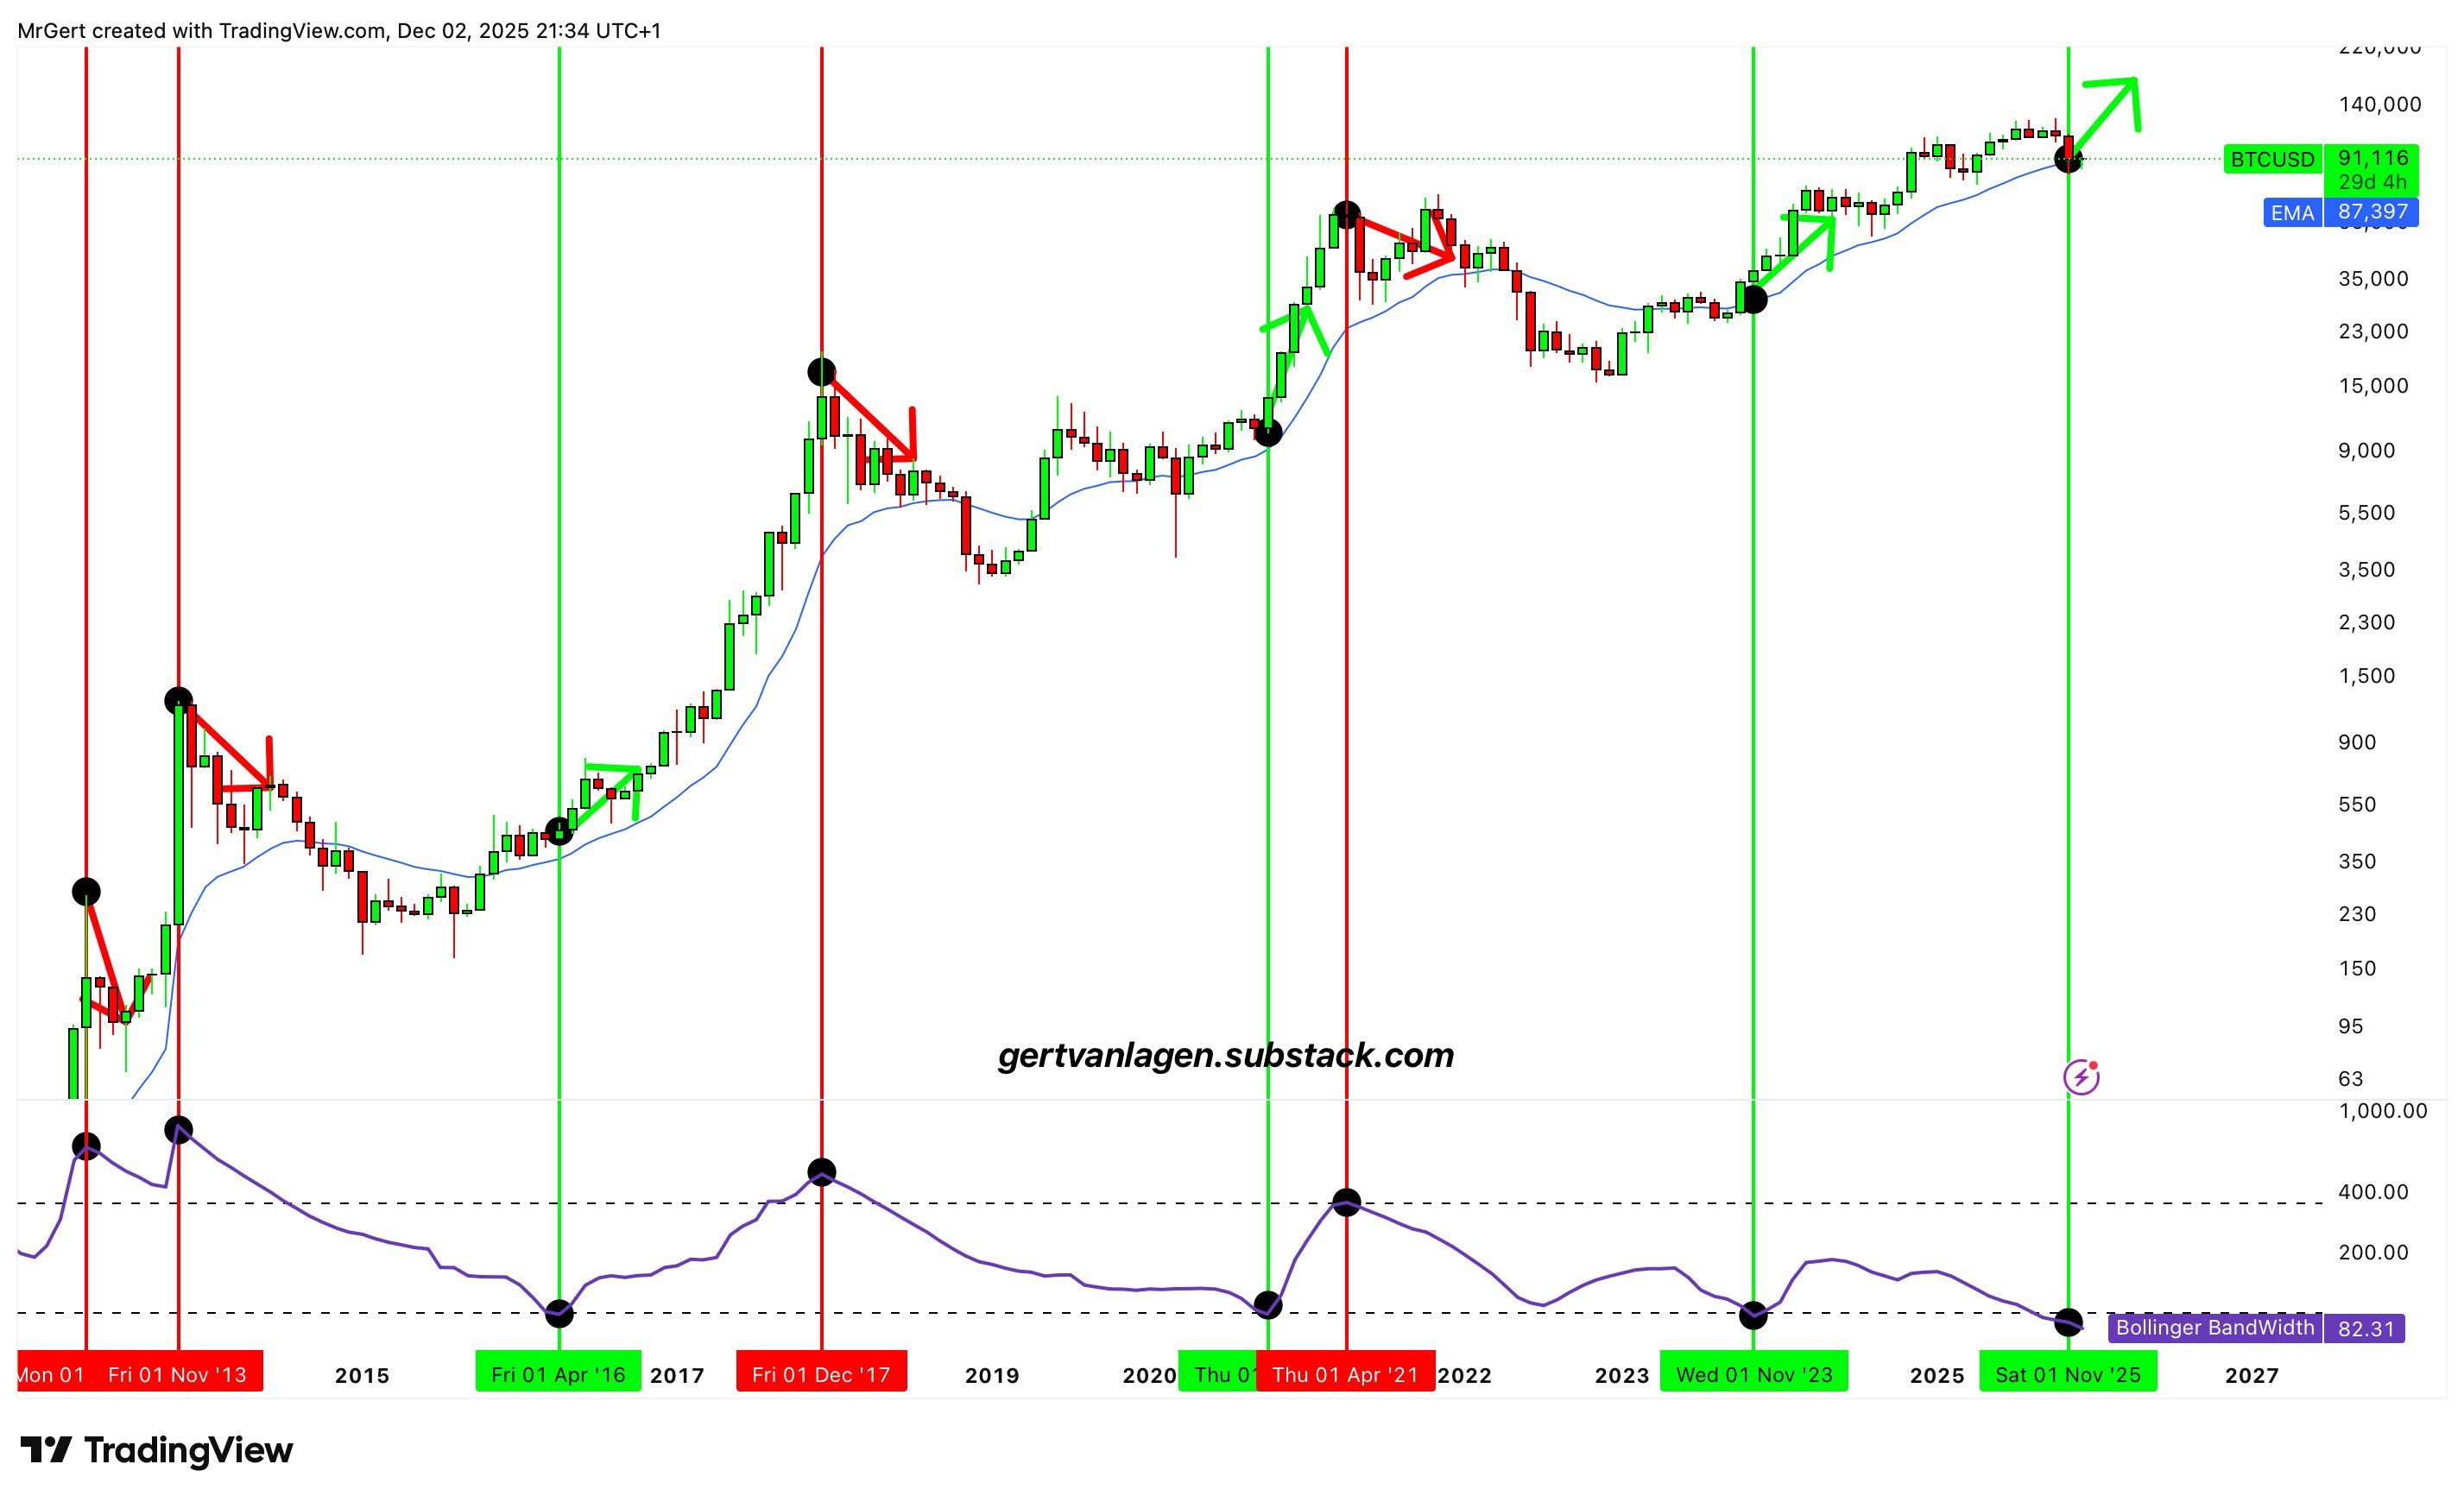
In an X thread on Wednesday, macro strategist Gert van Lagen presented a key signal from Bitcoin’s Bollinger BandWidth.
Bollinger BandWidth measures the percentage difference between the upper and lower Bollinger bands, which themselves act as a leading indicator for BTC price volatility.
On monthly timeframes, that difference has never been smaller, per data from sources including Cointelegraph Markets Pro and TradingView .
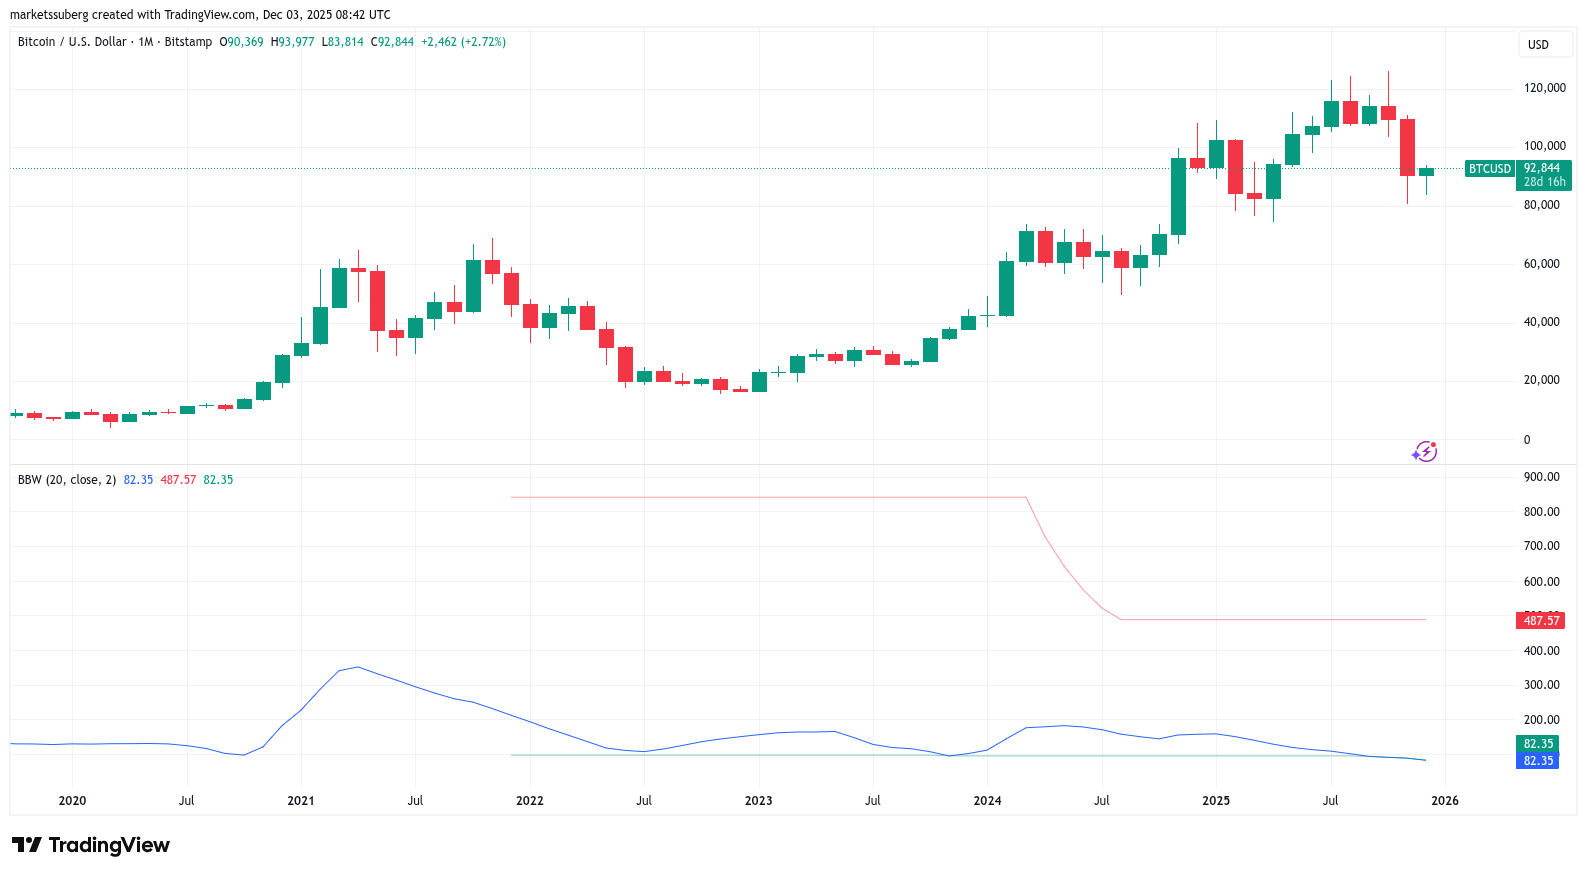 BTC/USD one-month chart with Bollinger BandWidth data. Source: Cointelegraph/TradingView
History shows that BandWidth rarely drops below 100 on its scale, but each time it does, the BTC price reacts sharply.
“Historically, every time this triggers, Bitcoin follows with a direct parabolic leg up,” Van Lagen commented.
“No red signal flashed in the previous months…”
 BTC/USD one-month chart with Bollinger BandWidth data. Source: Gert van Lagen/X
An accompanying chart shows previous instances of such a parabolic result. The previous “green” signal came at the start of November 2023, after which BTC/USD doubled in four months.
Continuing, Van Lagen referenced his future BTC price expectations, which involve a final push to new highs before Bitcoin’s next bear market ensues.
“This setup is identical to GOOGL prior to its final blow off wave, right before the 2008 financial crisis. A cascade of lower highs on the Bollinger Bandwidth, which gets broken to feed the subsequent bearish HTF volatility,” he wrote.
Too soon to celebrate?
Bitcoin traders remain unconvinced by market strength this week amid tentative signs of a recovery.
Related: Bitcoin's ‘more reliable’ RSI variant hits bear market bottom zone at $87K
$BTC 1W
— Roman (@Roman_Trading) December 2, 2025
Still just a breakdown & retest scenario until proven otherwise. Still going to plan.
Volume is low, MACD/RSI needed a reset on 1D and below, + we dropped 45k with no bounce.
I wouldn’t get loud on calling a bottom quite yet.
On Wednesday, BTC/USD reached its highest levels in over two weeks, eyeing $94,000 on the back of rumors of a pro-crypto US Federal Reserve chair .
“Price did now make a higher high and higher low, so technically the market structure is back to bullish on this timeframe,” trader Daan Crypto Trades acknowledged in an X post.
“But to properly get this going I want to see it sustain above this current price area.”
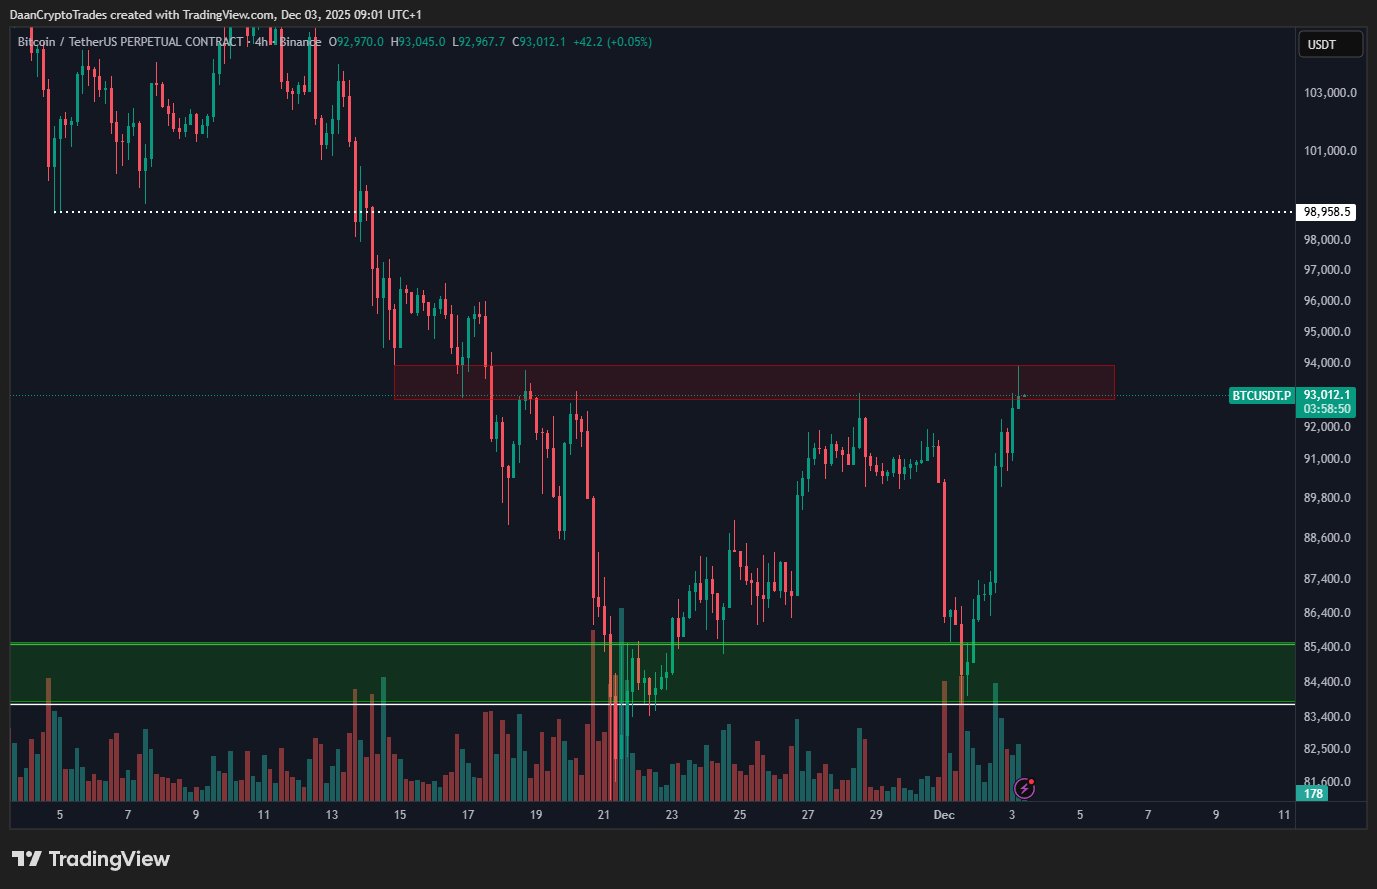 BTC/USDT perpetual contract four-hour chart. Source: Daan Crypto Trades/X
As Cointelegraph reported , the current spot price zone holds significant importance for the 2025 yearly candle, with BTC/USD starting the year at $93,500.
“Bitcoin has an entire month to perform 2% upside to end the month above the ~$93500 Four Year Cycle level and close the year as a green candle,” trader and analyst Rekt Capital noted Tuesday.
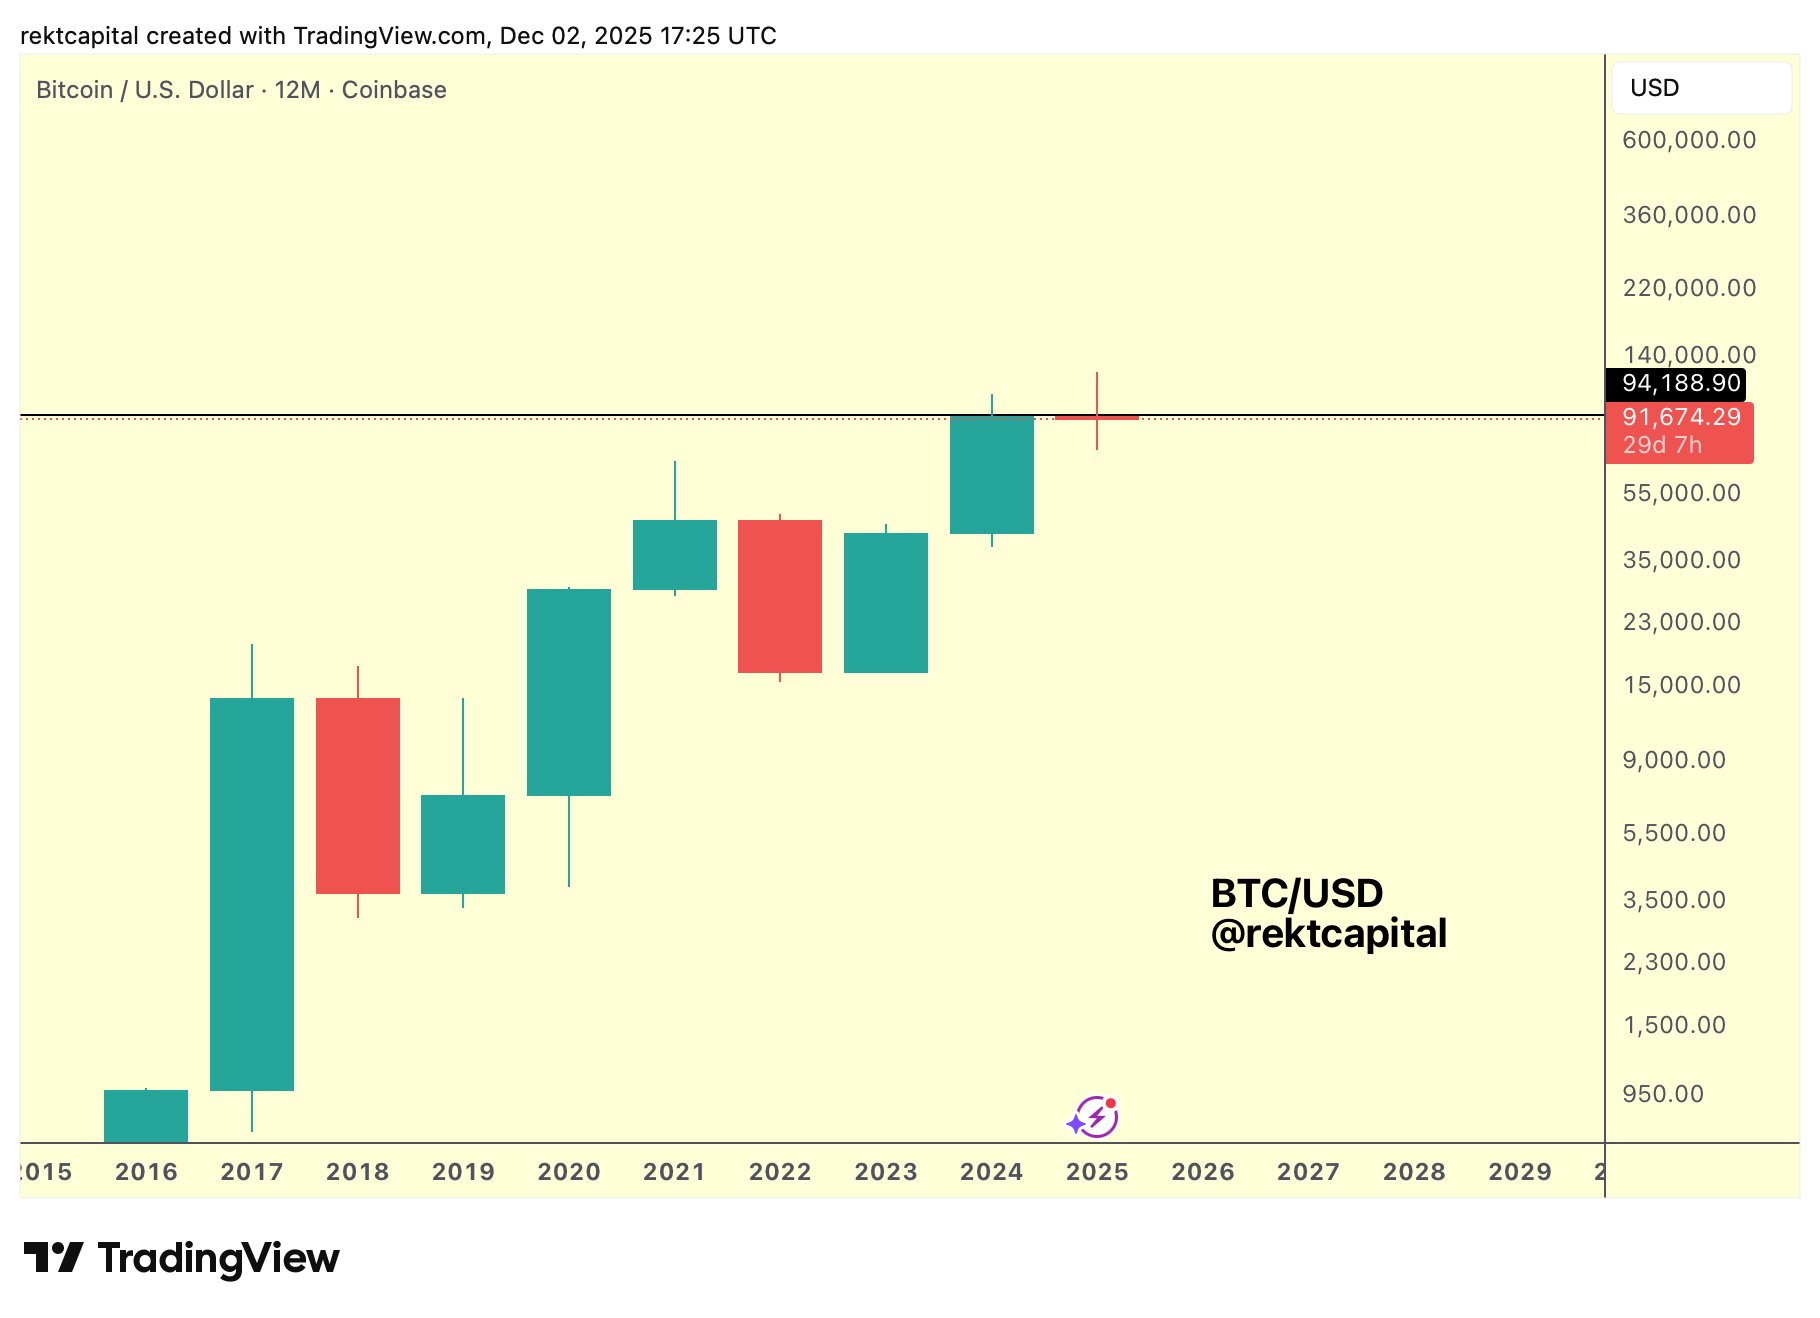 BTC/USD 12-month chart. Source: Rekt Capital/X