- XRP is trading at $2.92, up 1.7% in 7 days, with resistance at $2.92 and support holding near $2.82.
- Heatmap data highlights a large liquidity cluster at $2.25, which could attract price interaction if pressure builds.
- RSI at 66.78 and MACD readings show balanced momentum, reflecting XRP’s current sideways consolidation.
XRP is drawing heightened market focus as heatmap data revealed a large cluster of liquidity positioned around $2.25. The asset is currently trading at $2.92 after a 1.7% gain over the past week. Market activity remains concentrated between its $2.82 support and $2.92 resistance, while momentum indicators suggest near-term volatility.
Liquidity Cluster at $2.25 Emerges as Key Short-Term Focus
Recent heatmap data shows a dense concentration of orders at $2.25. This cluster reflects a potential area where liquidity could attract price movement. Traders often monitor such regions closely, as heavy concentrations can influence short-term behavior. The chart highlights this zone as one of the strongest liquidity points since early September.
Meanwhile, XRP’s broader trend has been relatively steady. Price has consolidated after earlier advances, stabilizing near its current range. The asset’s daily activity demonstrates repeated tests of both support and resistance, yet without a decisive breakout in either direction. This keeps attention fixed on whether price activity may interact with the highlighted liquidity level.
Technical Indicators Show Neutral Momentum with Slight Upward Bias
Relative strength index (RSI) is at the moment at 66.78. The level is just below overbought conditions with a slight tendency of leaning towards the buying strength. Nonetheless, RSI has constantly ranged between 50 and 70 over the recent sessions meaning that the price is in a neutral band which fluctuates frequently.
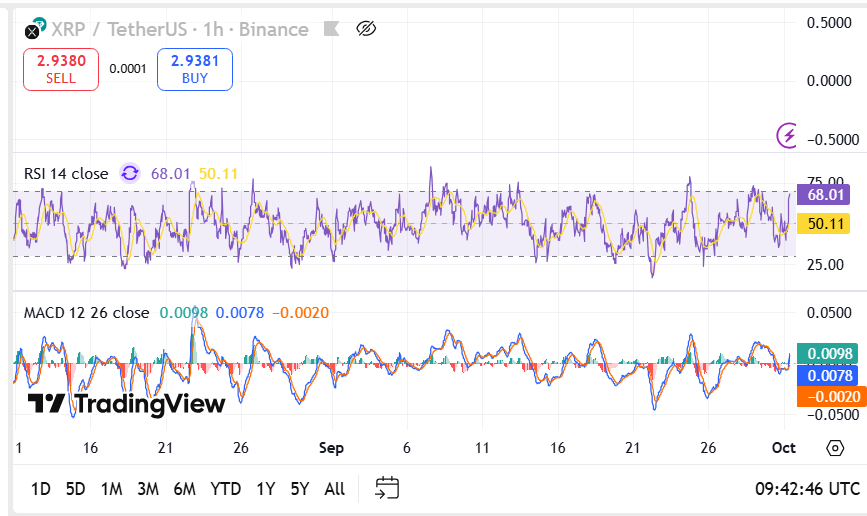 Source: TradingView
At the same time, the moving average convergence divergence (MACD) offers further clarity. MACD line is at 0.0092 compared to a signal line at 0.0071 with the histogram of -0.0021. These readings indicate balanced momentum having slight upward bias. Interestingly, the indicator has been fluctuating between high and low in the recent weeks in a manner that is similar to the horizontal trend observable in the chart.
Price Levels and Market Context
With XRP currently trading at $2.92, the $2.82 support continues to mark the lower boundary of its immediate range. The $2.92 resistance has persistently capped upside, with price action closely contained within the range . In this context, the liquidity cluster at $2.25 assumes additional significance as an area that may attract interest in the event downside pressure increases.
Market players are therefore watching two things: the depth of support at $2.82 and how price acts around the liquidity pool lower down the chart. Together, these elements form the parameters of XRP’s near-term market activity as price consolidates within a narrow range.