- ETH continues its bullish trend above 3,700, increasing in volume and continued buyer activity despite the dip and profit taking that occurred near 3,840.
- SOL has remained within the trading channel of between $176 and $180 without any distinct movement in this direction, as the volume levels have been showing.
- XRP’s early rally fizzles out, with fading volume and sideways consolidation suggesting waning momentum and market indecision.
Tracking North and South. Each of the top altcoins is taking very different directions as the crypto market explores a period of heightened volatility. Ethereum (ETH) has an impressive bullish trend that it is currently on, whereas Solana (SOL) is stuck between the buyers and the sellers. In the meantime, XRP is also lacking the strength of its initial rally, recuperating at the holding stage.
Despite the pullback, Ethereum (ETH) remains bullish.
Ethereum (ETH) has taken the uptrend trend very well on the 1-hour chart heading to July 21. The pair lost bullish momentum and dropped below $3,440 after experiencing a bullish momentum and sprinting to an all-time high of approximately $3,840 recently. The rally commenced somewhere in mid-July 19 and was strengthened by a sustained rise in volume of trading, a fact that shows an uprise in participation of the market.
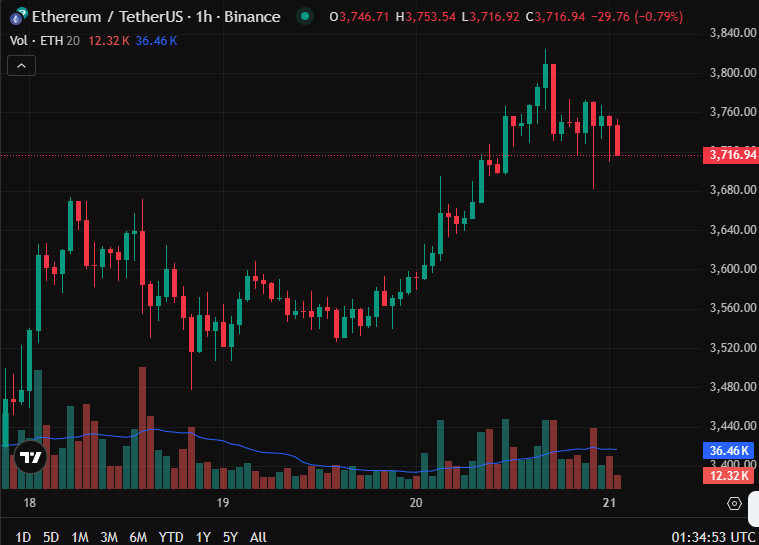
As the price approached the $3,840 zone, traders began taking profits. This activity led to a slight pullback, with the current trading level at approximately $3,726.42. The price remains above the 20-period volume-weighted average, suggesting that bullish sentiment continues to hold. Market activity shows that buyers remain active, although short-term fluctuations could
Solana (SOL) Trades in a Volatile Range With No Clear Direction
Solana (SOL) has experienced mixed signals over the past few sessions. The 1-hour chart indicates that SOL hit a local high near $184 on July 18 before pulling back. The asset then entered a consolidation phase, trading between $176 and $180.
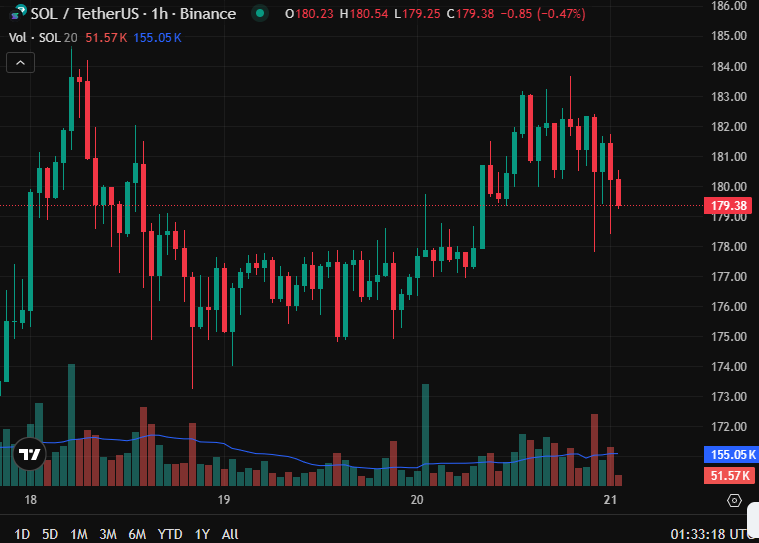
On July 20, renewed buying pushed the price slightly above $182. However, the movement was short-lived as a sharp red candle followed, pushing the price down to the current level of $178.80. This drop reflects increased selling pressure or profit-taking as traders respond to rapid gains.
Volume has picked up alongside these movements, suggesting heightened trader engagement during price fluctuations. The recent spike in volume shows that market participants are actively monitoring support and resistance levels for short-term decisions.
XRP Struggles to Sustain Momentum Following Early Rally
XRP showed a notable rally on July 18, with the price rising sharply from under $3.00 to a local high of about $3.65. Following this move, XRP entered a phase of sideways movement, consolidating between $3.35 and $3.55 for the next two days.
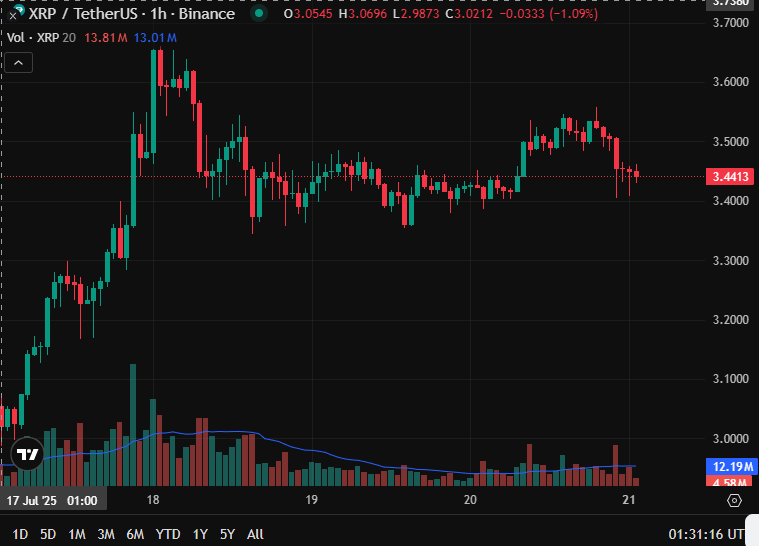
Despite a brief push early on July 20, the upward momentum faded, and the price began to decline. XRP now trades around $3.4393. The 1-hour diagram indicates a decline in the volume as compared to the previous rally, which indicates that buyers are not interested. Some sharp volume rises are evidence of trying to get back in the market, but nothing in regard to carrying momentum.
Findings: Splitting Apart Points to the Commitment in the Leading Altcoins Over Time
The crypto market is transitioning towards an era of high volatility, and Ethereum, Solana, and XRP show three distinct technical perspectives. Ethereum is currently bullish with an increasing trading volume and price above important moving averages.
Solana is still within a strong consolidation range with no directional bias. Both price volatility and increases in the trading by short-term traders indicate that these traders are increasing their activity, but the overall tone indicates that this is neutral.
XRP, once running on an initial price rally, has moved to a laydown period with a shrinking volume. This shifting in motion may lead to sidewaystrading unless there is reemergent buying force.