Bitget:全球日交易量排名前 4!
BTC 市占率61.94%
Bitget 新幣上架 : Pi
BTC/USDT$103179.25 (+0.11%)恐懼與貪婪指數70(貪婪)
山寨季指數:0(比特幣季)
比特幣現貨 ETF 總淨流量:+$321.4M(1 天);+$2.02B(7 天)。Bitget 新用戶立享 6,200 USDT 歡迎禮包!立即領取
到 Bitget App 隨時隨地輕鬆交易!立即下載
Bitget:全球日交易量排名前 4!
BTC 市占率61.94%
Bitget 新幣上架 : Pi
BTC/USDT$103179.25 (+0.11%)恐懼與貪婪指數70(貪婪)
山寨季指數:0(比特幣季)
比特幣現貨 ETF 總淨流量:+$321.4M(1 天);+$2.02B(7 天)。Bitget 新用戶立享 6,200 USDT 歡迎禮包!立即領取
到 Bitget App 隨時隨地輕鬆交易!立即下載
Bitget:全球日交易量排名前 4!
BTC 市占率61.94%
Bitget 新幣上架 : Pi
BTC/USDT$103179.25 (+0.11%)恐懼與貪婪指數70(貪婪)
山寨季指數:0(比特幣季)
比特幣現貨 ETF 總淨流量:+$321.4M(1 天);+$2.02B(7 天)。Bitget 新用戶立享 6,200 USDT 歡迎禮包!立即領取
到 Bitget App 隨時隨地輕鬆交易!立即下載


Sky 價格SKY
上架
報價幣種:
TWD
NT$2.32+6.03%1D
價格圖表
TradingView
市值
Sky價格走勢圖 (SKY/TWD)
最近更新時間 2025-05-10 21:11:45(UTC+0)
市值:--
完全稀釋市值:--
24 小時交易額:NT$214,990,426.94
24 小時交易額/市值:0.00%
24 小時最高價:NT$2.33
24 小時最低價:NT$2.17
歷史最高價:NT$3.07
歷史最低價:NT$1.04
流通量:-- SKY
總發行量:
23,463,144,887SKY
流通率:0.00%
最大發行量:
--SKY
以 BTC 計價:0.{6}7442 BTC
以 ETH 計價:0.{4}3075 ETH
以 BTC 市值計價:
--
以 ETH 市值計價:
--
合約:
0x5607...DEd9279(Ethereum)
更多
您今天對 Sky 感覺如何?
注意:此資訊僅供參考。
Sky 的 AI 分析報告
今日加密市場熱點查看報告
今日Sky即時價格TWD
今日 Sky 即時價格為 NT$2.32 TWD,目前市值為 NT$0.00。過去 24 小時內,Sky 價格漲幅為 6.03%,24 小時交易量為 NT$214.99M。SKY/TWD(Sky 兌換 TWD)兌換率即時更新。
Sky價格歷史(TWD)
過去一年,Sky價格上漲了 +14.65%。在此期間,SKY兌TWD 的最高價格為 NT$3.07,SKY兌TWD 的最低價格為 NT$1.04。
時間漲跌幅(%) 最低價最高價
最低價最高價 24h+6.03%NT$2.17NT$2.33
7d+21.25%NT$1.78NT$2.33
30d+43.15%NT$1.61NT$2.33
90d+105.76%NT$1.11NT$2.33
1y+14.65%NT$1.04NT$3.07
全部時間+11.72%NT$1.04(2025-02-03, 97 天前 )NT$3.07(2024-12-03, 159 天前 )
Sky的最高價格是多少?
Sky兌換TWD的歷史最高價(ATH)為 NT$3.07,發生於 2024-12-03。相較於價格回撤了 24.29%。
Sky的最低價格是多少?
Sky兌換TWD的歷史最低價(ATL)為 NT$1.04,發生於 2025-02-03。相較於Sky歷史最低價,目前Sky價格上漲了 123.92%。
Sky價格預測
什麼時候是購買 SKY 的好時機? 我現在應該買入還是賣出 SKY?
在決定買入還是賣出 SKY 時,您必須先考慮自己的交易策略。長期交易者和短期交易者的交易活動也會有所不同。Bitget SKY 技術分析 可以提供您交易參考。
根據 SKY 4 小時技術分析,交易訊號為 強力買入。
根據 SKY 1 日技術分析,交易訊號為 強力買入。
根據 SKY 1 週技術分析,交易訊號為 強力買入。
SKY 在 2026 的價格是多少?
根據SKY的歷史價格表現預測模型,預計SKY的價格將在 2026 達到 NT$2.05。
SKY 在 2031 的價格是多少?
2031,SKY的價格預計將上漲 +23.00%。 到 2031 底,預計SKY的價格將達到 NT$3.65,累計投資報酬率為 +63.11%。
常見問題
Sky 的目前價格是多少?
Sky 的即時價格為 NT$2.32(SKY/TWD),目前市值為 NT$0 TWD。由於加密貨幣市場全天候不間斷交易,Sky 的價格經常波動。您可以在 Bitget 上查看 Sky 的市場價格及其歷史數據。
Sky 的 24 小時交易量是多少?
在最近 24 小時內,Sky 的交易量為 NT$214.99M。
Sky 的歷史最高價是多少?
Sky 的歷史最高價是 NT$3.07。這個歷史最高價是 Sky 自推出以來的最高價。
我可以在 Bitget 上購買 Sky 嗎?
可以,Sky 目前在 Bitget 的中心化交易平台上可用。如需更詳細的說明,請查看我們很有幫助的 如何購買 sky 指南。
我可以透過投資 Sky 獲得穩定的收入嗎?
當然,Bitget 推出了一個 機器人交易平台,其提供智能交易機器人,可以自動執行您的交易,幫您賺取收益。
我在哪裡能以最低的費用購買 Sky?
Bitget提供行業領先的交易費用和市場深度,以確保交易者能够從投資中獲利。 您可通過 Bitget 交易所交易。
Sky 資訊
查看更多
Sky行情
Sky持幣分布集中度
巨鯨
投資者
散戶
Sky地址持有時長分布
長期持幣者
游資
交易者
coinInfo.name(12)即時價格表

全球Sky價格
目前Sky用其他貨幣計價是多少?最近更新時間:2025-05-10 21:11:45(UTC+0)
SKY 兌換 MXN
Mexican Peso
Mex$1.49SKY 兌換 GTQGuatemalan Quetzal
Q0.59SKY 兌換 CLPChilean Peso
CLP$71.71SKY 兌換 UGXUgandan Shilling
Sh281.75SKY 兌換 HNLHonduran Lempira
L2SKY 兌換 ZARSouth African Rand
R1.4SKY 兌換 TNDTunisian Dinar
د.ت0.23SKY 兌換 IQDIraqi Dinar
ع.د100.89SKY 兌換 TWDNew Taiwan Dollar
NT$2.32SKY 兌換 RSDSerbian Dinar
дин.7.94SKY 兌換 DOPDominican Peso
RD$4.52SKY 兌換 MYRMalaysian Ringgit
RM0.33SKY 兌換 GELGeorgian Lari
₾0.21SKY 兌換 UYUUruguayan Peso
$3.21SKY 兌換 MADMoroccan Dirham
د.م.0.71SKY 兌換 AZNAzerbaijani Manat
₼0.13SKY 兌換 OMROmani Rial
ر.ع.0.03SKY 兌換 KESKenyan Shilling
Sh9.93SKY 兌換 SEKSwedish Krona
kr0.75SKY 兌換 UAHUkrainian Hryvnia
₴3.2- 1
- 2
- 3
- 4
- 5
如何購買Sky(SKY)

建立您的免費 Bitget 帳戶
使用您的電子郵件地址/手機號碼在 Bitget 註冊,並建立強大的密碼以確保您的帳戶安全

認證您的帳戶
輸入您的個人資訊並上傳有效的身份照片進行身份認證

將 Sky 兌換為 SKY
在 Bitget 上選擇加密貨幣進行交易。
了解更多
購買其他幣種


您可以在哪裡購買Sky(SKY)?
影片部分 - 快速認證、快速交易

如何在 Bitget 完成身分認證以防範詐騙
1. 登入您的 Bitget 帳戶。
2. 如果您是 Bitget 的新用戶,請觀看我們的教學,以了解如何建立帳戶。
3. 將滑鼠移到您的個人頭像上,點擊「未認證」,然後點擊「認證」。
4. 選擇您簽發的國家或地區和證件類型,然後根據指示進行操作。
5. 根據您的偏好,選擇「手機認證」或「電腦認證」。
6. 填寫您的詳細資訊,提交身分證影本,並拍攝一張自拍照。
7. 提交申請後,身分認證就完成了!
加密貨幣投資(包括透過 Bitget 線上購買 Sky)具有市場風險。Bitget 為您提供購買 Sky 的簡便方式,並且盡最大努力讓用戶充分了解我們在交易所提供的每種加密貨幣。但是,我們不對您購買 Sky 可能產生的結果負責。此頁面和其包含的任何資訊均不代表對任何特定加密貨幣的背書認可,任何價格數據均採集自公開互聯網,不被視為來自Bitget的買賣要約。
Sky評級
社群的平均評分
4.6
此內容僅供參考。
Bitget 觀點
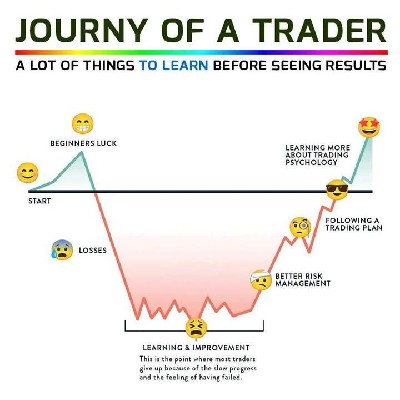
sadiqmaimalari
13小時前
In the bull market, everyone’s a genius—until the music stops."
I learned this the hard way.
Back in the last bull run, I wasn’t some chart wizard or trading expert. I didn’t spend hours analyzing candles or predicting price patterns. My knowledge was basic: buy low, sell high. Simple, right?
But guess what? That simplicity made me more money than some of the so-called trading pros around me.
I had a colleague who was deep into technical analysis. He'd spend hours breaking down market structures, studying support and resistance, calculating Fibonacci levels. Meanwhile, I focused on strong projects with real-world utility. Once my RSI said "oversold," I bought. When it said "overbought," I sold.
And while he was waiting for the perfect entry, I was banking profits. In the bull market, momentum is king—and even basic strategies can win big. It felt like everyone was making money. Confidence was sky-high.
But then... the music stopped.
The bear market came without warning.
There were no signs saying, “It’s over now.” Tokens just started bleeding, influencers went silent, and portfolios shrank overnight.
That’s when reality hit:
Bull markets reward confidence.
Bear markets reward knowledge.
What saved me wasn’t luck—it was experience and the lessons I learned from previous cycles. The market doesn’t care how hyped you are. It cares how prepared you are.
So here’s my message to every crypto trader and investor riding this current wave:
Celebrate your wins, but don’t confuse a bull market with skill.
The real test is how you move when the market turns red.
Learn. Stay humble. Know when to buy—and more importantly, know when to sell.
Because when the bull runs out of breath, only the wise keep standing.
RED+2.93%
MOVE+4.55%

shidde
22小時前
When it comes to TRADING Indicators in the Market, how it is different from how some people see it, or understand it!...
How to use indicators to identify entry or exit from the market is good.
Any Indicator that exists is used to look at the market before using it to find an Entry or Exit:
Let's take an example of Bollinger band (BB):
BOLLINGER is a Lagging indicator, which tells us about something in the market as soon as it happens.
For example, once a Breakout of a support or resistance in the market is made. When we see that the Upper Band of this BB is broken, it will confirm to us that a successful Breakout was not made (Although it can also be a Fakeout) But it is difficult, not like in Price action.
When we talk about "Lagging indicator", then we say that BB is one of these categories of Lagging indicator.
I mean that it is an Indicator that tells us about something as soon as it happens, as I gave the example above.
To better understand Lagging indicators, let's take an example of what actually happens, which is an indicator.
For example: if you see smoke rising from the sky, you see this shows you that a fire has started in the area where the smoke is rising, you see there is no way to see smoke above the sky without a fire, if we see smoke rising, it must be an indicator that tells us that a fire has started. (This is called Lagging).
But in the RSI example that I gave (in the article I wrote earlier) and gave an example of Danger, if we look at it, we will see that a danger can appear without rain falling. You see, it announces something before it happens (meaning it is a Leading indicator).
Hope you understand this!?
Let's continue...
It is not possible to say that you can always trade with just one indicator!!!
Why?
Because the market is always changing, From "UP-TREND," to "Consolidation", to "DOWN TREND,"...
The market may know that it is in an Up-trend for a long time, But keep in mind, one day the market must turn.
Now for an example:
Let's take BOLLINGER BAND (BB), this indicator is traded when the market is CONSOLIDATING/RANGING.
It has 3 parts:
1. Upper BAND.
2. Middle BAND.
3. Lower BAND.
How you trade it is: you wait for the price to come to the Lower BAND, then you buy. When it goes back to the Upper BAND Middle BAND, then you sell, and exit the market.
So you see, if the market is rising and you activate BOLLINGER BAND, it will be as if you are: TRADING AGAINST THE TRADE (meaning the market is falling and you are making a purchase decision). Since it works when the market is Consolidating.
See if the market is rising, There is one indicator you should use, For example let's take Moving average(SMA/EMA). Or MACD(Moving average convergence divergences).
See Moving average can be used to understand the duration of this trend:
1. LONG TERM BULLISH/BEARISH TREND.
2. MEDIUM TERM BULLISH/BEARISH TREND.
3. SHORT TERM BULLISH/BEARISH TREND.
And you can also use it (moving average) As support or resistance. And so on.
Also, MACD is also used when the market is Up-trend, Because it is a Lagging indicator, it tells us when something happens.
In the MACD section we can look at DIVERGENCE, Although RSI is the best indicator I use to understand DIVERGENCE.
And we can also trade HISTOGRAM, or ZERO CROSSES. All this under MACD.
Sometimes we use these indicators just to get more confirmation on this drawing you made in price Action. Make sure you are not wrong, Because Investors can manipulate Price, But if you use Indicator. It is very difficult to manipulate you.
My advice to you is, understand your Trading system, then take indicators that are suitable for this system, and always Trade with them.
Don't say that you will activate any indicator, because that will ruin your entire system.
That will help you a lot in Making faster decisions, which will make your trading process much more efficient.
May Allah grant us success in what we set out to do!!
Thanks
FIRE+2.68%
UP+4.09%
Mr,crypto2020
3天前
Bitcoin 97,000$ 🙌 📊 What next
a little pull back then sky rocket 🚀
BITCOIN+17.11%
SKY+6.37%
Bitcoin_for_Freedom
4天前
The Bitcoin hash rate is sky rocketing, the M2 money supply is soaring, New Hampshire signed a BTC bill, BTC on exchanges fell by 90k the last month, ETFs are buying 5k BTC per day, Strategy and Twenty One are competing for the most BTC. Everything is set for the bull run!🚀
BTC+0.21%
SKY+6.37%

AhmedAlgoTrader
4天前
Spark Commits Additional $1 Billion to Lead Tokenized Treasuries Sector
Spark has allocated another $1 billion to tokenized U.S. Treasuries, bringing its total deployment to $2.4 billion across three funds.

By Vismaya V
May 6, 2025
3 min read

A spark. Image: Shutterstock
In brief
Spark, part of the Sky (formerly MakerDAO) ecosystem, has allocated another $1B to tokenized U.S. Treasury-backed RWAs, raising its total TVL to $2.4B.
The new funds go to BlackRock/Securitize’s BUIDL, Superstate’s USTB, and Centrifuge-Anemoy’s JTRSY—the same recipients from Spark’s Tokenization Grand Prix.
Spark now controls over two-thirds of the $3.5B tokenized U.S. Treasuries market, solidifying its lead in on-chain RWA deployment.
S+1.63%
SKY+6.37%
相關資產


相近市值
在所有 Bitget 資產中,這8種資產的市值最接近 Sky。


關於Sky的更多資訊
交易
理財
您可以在 Bitget 上交易 SKY。
SKY/USDT
現貨