
XRP breaks slump with 9% surge as chart signals flip bullish

XRP jumped more than 9% over the past 24 hours after breaking out of a months-long downtrend, reclaiming key technical levels and reigniting bullish momentum across major altcoins.
- The rally marks XRP’s first decisive trend reversal since peaking near $3.40 in August.
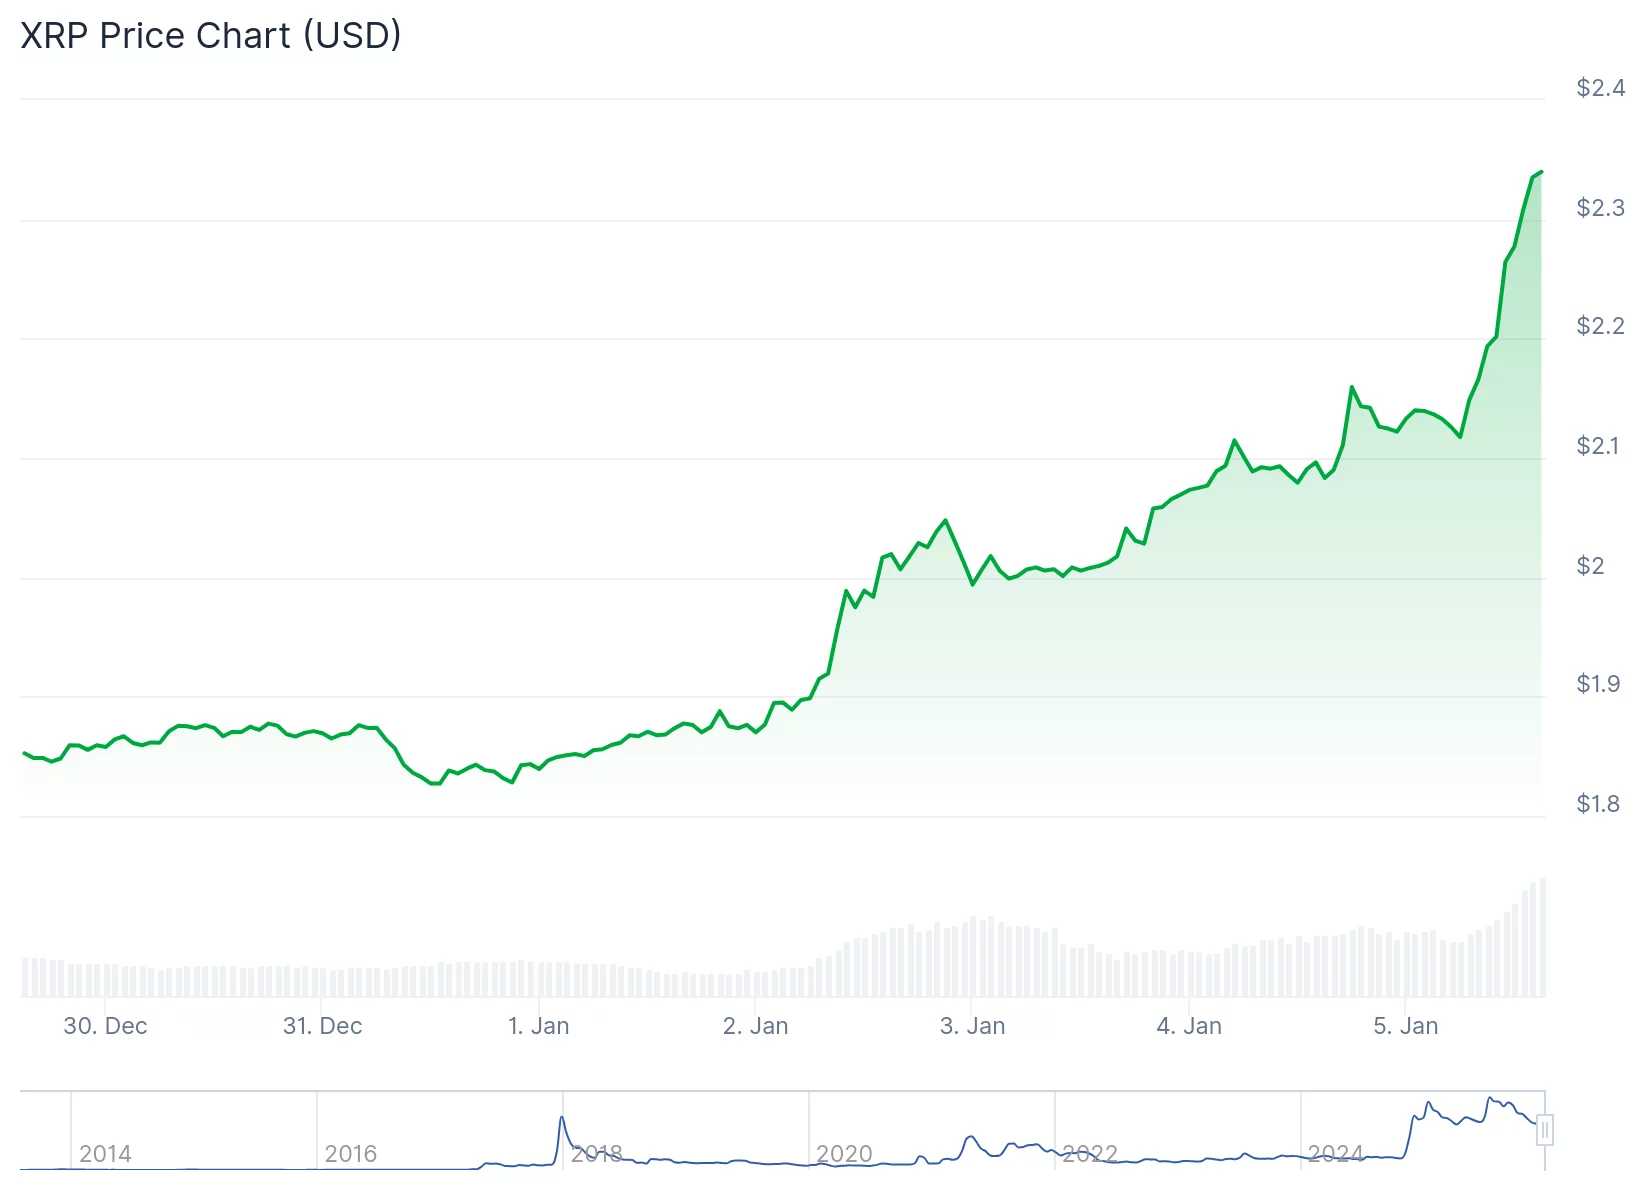
- Buyers pushed the token back above multiple moving averages, confirming a potential double-bottom formation near $1.80.
- Similar breakout setups are emerging in Cardano and Solana, suggesting broader risk appetite is returning to large-cap altcoins after weeks of consolidation.
XRP reclaimed critical support at $1.80 before surging through its 20-day ($1.97) and 50-day ($2.05) exponential moving averages, and is now testing resistance at the 100-day EMA near $2.22.
The Supertrend indicator has flipped bullish at $1.87, shifting from resistance to dynamic support—a notable momentum change following months of sideways price action.
Rising volume alongside the sharp move points to strong buyer conviction rather than a short-lived bounce.
A break above the 200-day EMA at $2.35 would place $2.60–$2.70 in focus, with a larger upside path toward $3.00 and the descending resistance zone between $3.20 and $3.40.
On the downside, bulls must defend $2.05 and $1.96; a loss of $1.80 would invalidate the bullish structure.
 Source:
Cardano
Cardano () is also flashing reversal signals, climbing nearly 5% after breaking out of a falling wedge that had compressed price action since October.
ADA rebounded from late-December lows near $0.35 and is now testing its 20-day EMA at $0.38, supported by rising volume and a bullish SAR flip at $0.34.
The pattern projects a move toward $0.50–$0.52, with resistance at $0.42 and $0.45-$0.47 along the way.
Solana
Solana () joined the move with a 3.6% gain, trading around $138 after reclaiming its 20-day EMA and defending the $120–$122 support zone multiple times in December.
A confirmed double bottom and heavy accumulation between $120 and $140 suggest institutional interest, though SOL faces near-term resistance at $140–$145.
Clearing that zone opens the door to $150 and $162, while failure risks a pullback toward $128.
Together, the synchronized breakouts indicate a broader shift in market structure—one in which altcoins are emerging from prolonged corrective phases.
Disclaimer: The content of this article solely reflects the author's opinion and does not represent the platform in any capacity. This article is not intended to serve as a reference for making investment decisions.
You may also like
BlockDAG’s $0.003 Entry Signals a 16.6x Upside While Uniswap & XRP Lack Momentum

Whale Turns $68K Into $4.48M as WHITEWHALE Hits $140M Cap
Altcoins Face Bearish Order Block Rejection — 4 High-Risk Coins With 60%–120% Upside if the Flip Holds
Pentagon Index Issues New Warning, Likelihood of "US Attack on Iran by the End of January" Rises to 46%