- BNB price dropped to under $850 as cryptocurrencies solld-off.
- The Binance ecosystem token could dump to $800 or lower if bears strengthen.
- Technical indicators suggest sellers have upper hand in the short term.
BNB faces intensified selling pressure as bulls fail to hold onto gains made in recent sessions, mirroring losses around the broader cryptocurrency market.
As of writing on December 23, 2025, BNB traded around $851, down 1.5% in the past 24 hours as fresh volatility hit risk assets.
While price is off intraday lows of $847, the current outlook suggests bulls risk a revisit of recent key support levels.
BNB price faces fresh bearish pressure
As noted, the BNB price is trading in negative territory
This comes as sellers maintain control following a recent spike to $870, with profit-taking driving the token towards critical support levels.
In the past day, the altcoin has touched $847, and the technical picture signals a potential for further downside if bulls fail to defend this zone.
Market data indicates that BNB has declined more than 11% from its December high of above $920.
Amid the downturn across crypto this past week, the token touched intraday lows of $819.
While buyers then saw a modest rebound to above $870 amid regulatory milestones, the price remains well off its year-to-date peak and all-time high reached in October.
The downturn that has BNB price 38% off the ATH coincides with diminishing activity on the BNB Chain network.
Per blockchain explorer data, daily transactions have fallen nearly 47% from October peaks.
Reduced transaction volumes often reflect lower user and developer engagement, which can erode demand for the native token and contribute to price weakness.
BNB is also signalling market weakness via its derivatives numbers.
Data on Coinglass shows caution has futures open interest for BNB down from over $2.97 billion in October to $1.28 billion as of writing.
Position unwinding and decreased leveraged exposure are key catalysts.
BNB price forecast
From a technical perspective, BNB remains in a downtrend despite a breakout from a trendline on the daily timeframe seen in November.
Recovery also hit a supply wall near the 50-day exponential moving average.
Notably, bulls have defended the support around $825 – a reload from which buyers elevated the token in August to its peak in October.
But bearish signals dominate key indicators on the daily chart.
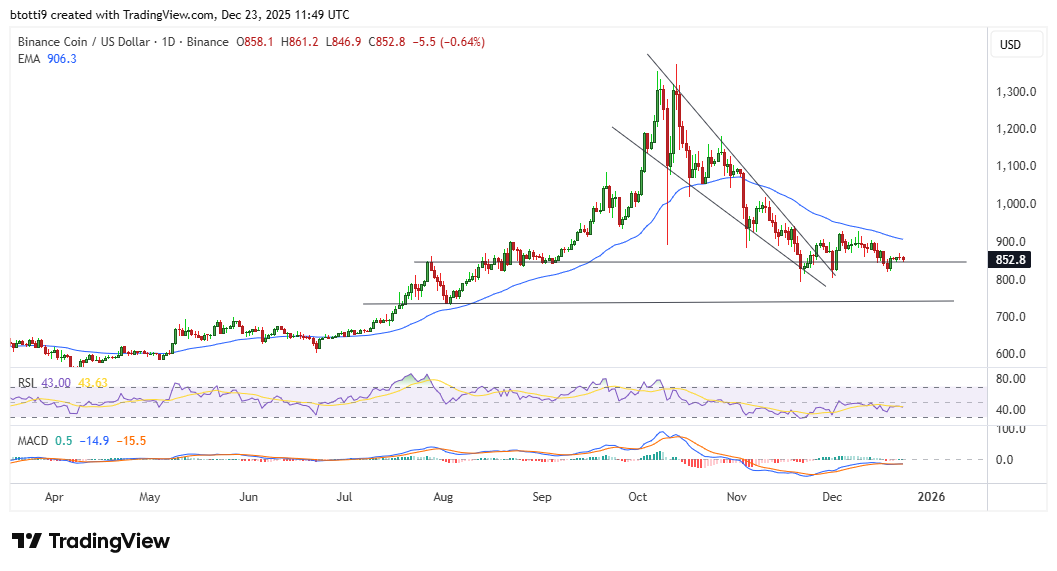 BNB price chart by TradingView
The Moving Average Convergence Divergence (MACD) highlights fading momentum, while the RSI indicator has flatlined below the neutral mark.
If downside action strengthens, a dip below the support trendline could allow bears to eye $738 and then $647.
On the flipside, a decisive breakout above the $875 threshold could shift sentiment, opening the door to renewed gains towards $1,000.