
Ethereum Exchange Outflows Soar To $978M: Sign Of Dip Buying?

By:Newsbtc
On-chain data shows the Ethereum exchange netflow has witnessed a negative spike during the past week, a potential sign that investors have been accumulating.
Ethereum Exchange Netflow Has Been Red For The Past Week
As pointed out by institutional DeFi solutions provider Sentora in a new post on X, Ethereum has seen net outflows from exchanges in the past week. The indicator of relevance here is the “Exchange Netflow,” which measures the net amount of ETH that’s moving into or out of wallets connected with centralized exchanges.
When the value of this metric is positive, it means the investors are depositing a net number of tokens to these platforms. As one of the main reasons why holders deposit their coins to exchanges is for selling-related purposes, this kind of trend can be bearish for the asset’s price.
var rnd = window.rnd || Math.floor(Math.random()*10e6); var pid607465 = window.pid607465 || rnd; var plc607465 = window.plc607465 || 0; var abkw = window.abkw || ''; var absrc = 'https://servedbyadbutler.com/adserve/;ID=172179;size=0x0;setID=607465;type=js;sw='+screen.width+';sh='+screen.height+';spr='+window.devicePixelRatio+';kw='+abkw+';pid='+pid607465+';place='+(plc607465++)+';rnd='+rnd+';click=CLICK_MACRO_PLACEHOLDER'; document.write('
');
if (!window.AdButler){(function(){var s = document.createElement("script"); s.async = true; s.type = "text/javascript";s.src = "https://servedbyadbutler.com/app.js";var n = document.getElementsByTagName("script")[0]; n.parentNode.insertBefore(s, n);}());}
var AdButler = AdButler || {}; AdButler.ads = AdButler.ads || []; var abkw = window.abkw || ""; var plc366606 = window.plc366606 || 0; (function(){ var divs = document.querySelectorAll(".plc366606:not([id])"); var div = divs[divs.length-1]; div.id = "placement_366606_"+plc366606; AdButler.ads.push({handler: function(opt){ AdButler.register(172179, 366606, [728,90], "placement_366606_"+opt.place, opt); }, opt: { place: plc366606++, keywords: abkw, domain: "servedbyadbutler.com", click:"CLICK_MACRO_PLACEHOLDER" }}); })();

On the other hand, the indicator being below zero suggests outflows are dominating the inflows on exchanges. Such a trend can be a sign that investors are in a phase of accumulation, which can naturally be bullish for the cryptocurrency.
As the data shared by Sentora shows, Ethereum has seen a weekly Exchange Netflow value of -$978.45 million, indicating that traders have made a massive amount of net withdrawals.
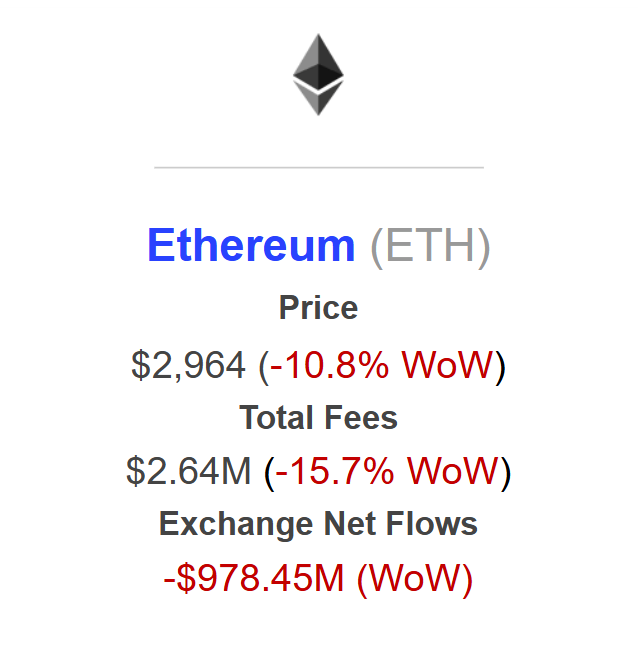 The weekly change in the ETH network fees and Exchange Netflow | Source:
Sentora on X
The weekly change in the ETH network fees and Exchange Netflow | Source:
Sentora on X
The significant outflows have come as Ethereum has witnessed a decline during the past week. As Sentora explains:
var rnd = window.rnd || Math.floor(Math.random()*10e6); var pid607472 = window.pid607472 || rnd; var plc607472 = window.plc607472 || 0; var abkw = window.abkw || ''; var absrc = 'https://servedbyadbutler.com/adserve/;ID=172179;size=0x0;setID=607472;type=js;sw='+screen.width+';sh='+screen.height+';spr='+window.devicePixelRatio+';kw='+abkw+';pid='+pid607472+';place='+(plc607472++)+';rnd='+rnd+';click=CLICK_MACRO_PLACEHOLDER'; document.write('
');
if (!window.AdButler){(function(){var s = document.createElement("script"); s.async = true; s.type = "text/javascript";s.src = "https://servedbyadbutler.com/app.js";var n = document.getElementsByTagName("script")[0]; n.parentNode.insertBefore(s, n);}());}
var AdButler = AdButler || {}; AdButler.ads = AdButler.ads || []; var abkw = window.abkw || ""; var plc452518 = window.plc452518 || 0; (function(){ var divs = document.querySelectorAll(".plc452518:not([id])"); var div = divs[divs.length-1]; div.id = "placement_452518_"+plc452518; AdButler.ads.push({handler: function(opt){ AdButler.register(172179, 452518, [728,90], "placement_452518_"+opt.place, opt); }, opt: { place: plc452518++, keywords: abkw, domain: "servedbyadbutler.com", click:"CLICK_MACRO_PLACEHOLDER" }}); })();
This signals aggressive accumulation where investors are likely “buying the dip” and withdrawing assets to cold storage or on-chain environments, tightening the liquid supply despite the negative price momentum.

Ethereum Risks Slide To $2,000 If December Closes Below This Level: Analyst
The price drawdown in the past week has also accompanied a drop in the total transaction fees on the network, meaning that transfer activity has gone down. The blockchain saw about $2.64 million in fees over the last week, which is more than 15% down week-over-week.
ETH Saw A Brief Visit Under $2,800 Before Rebounding
Ethereum observed a decline to $2,780 on Thursday, but the asset was able to bounce back as it’s now floating just under $3,000.
 The trend in the price of the coin over the last five days | Source:
ETHUSDT on TradingView
The trend in the price of the coin over the last five days | Source:
ETHUSDT on TradingView
Interestingly, ETH’s bottom was around the same level as a major on-chain supply cluster, as a chart shared by analyst Ali Martinez in an X post shows.
var rnd = window.rnd || Math.floor(Math.random()*10e6); var pid607473 = window.pid607473 || rnd; var plc607473 = window.plc607473 || 0; var abkw = window.abkw || ''; var absrc = 'https://servedbyadbutler.com/adserve/;ID=172179;size=0x0;setID=607473;type=js;sw='+screen.width+';sh='+screen.height+';spr='+window.devicePixelRatio+';kw='+abkw+';pid='+pid607473+';place='+(plc607473++)+';rnd='+rnd+';click=CLICK_MACRO_PLACEHOLDER'; document.write('
');
if (!window.AdButler){(function(){var s = document.createElement("script"); s.async = true; s.type = "text/javascript";s.src = 'https://servedbyadbutler.com/app.js';var n = document.getElementsByTagName("script")[0]; n.parentNode.insertBefore(s, n);}());}
var AdButler = AdButler || {}; AdButler.ads = AdButler.ads || []; var abkw = window.abkw || ''; var plc452519 = window.plc452519 || 0; (function(){ var divs = document.querySelectorAll(".plc452519:not([id])"); var div = divs[divs.length-1]; div.id = "placement_452519_"+plc452519; AdButler.ads.push({handler: function(opt){ AdButler.register(172179, 452519, [728,90], 'placement_452519_'+opt.place, opt); }, opt: { place: plc452519++, keywords: abkw, domain: 'servedbyadbutler.com', click:'CLICK_MACRO_PLACEHOLDER' }}); })();
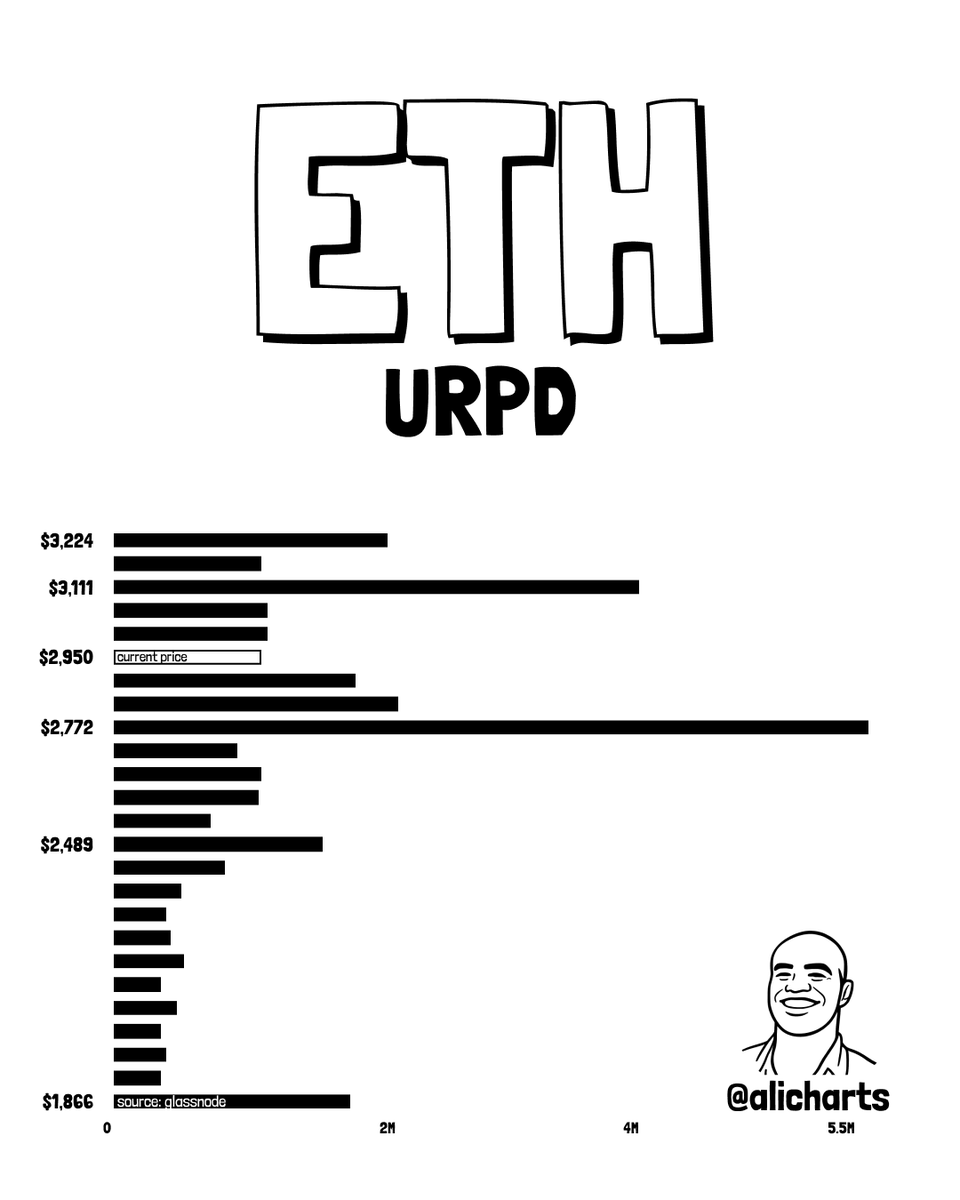 How the current URPD of ETH looks | Source:
@ali_charts on X
How the current URPD of ETH looks | Source:
@ali_charts on X
In the graph, Martinez has attached the data of the Ethereum UTXO Realized Price Distribution (URPD) from on-chain analytics firm Glassnode. This metric basically tells us how much ETH supply was last transacted at the various price levels that the coin has visited in its history.
There is a huge supply zone located at $2,772 on the URPD, suggesting a large amount of investors have their cost basis at it. Generally, such levels act as a support boundary during downtrends, as traders who purchased there buy the dip to defend it.
0
0
Disclaimer: The content of this article solely reflects the author's opinion and does not represent the platform in any capacity. This article is not intended to serve as a reference for making investment decisions.
PoolX: Earn new token airdrops
Lock your assets and earn 10%+ APR
Lock now!
You may also like
USDC Lending Goes Live on Farcaster via Morpho, Offering 5% Yield to Users
Coinotag•2025/12/20 03:15
Bitcoin Price Plummets: The Alarming Flight to Safety as US Economy Stumbles
Bitcoinworld•2025/12/20 03:12

Bitcoin Spot ETF IBIT Posts Over $25B Inflows Despite -9.59% Return, Ranks 6th Among US Stock ETFs
Coinotag•2025/12/20 03:03
Trending news
MoreCrypto prices
MoreBitcoin
BTC
$88,147.39
+2.13%
Ethereum
ETH
$2,981.4
+4.00%
Tether USDt
USDT
$0.9995
-0.01%
BNB
BNB
$855.97
+2.96%
XRP
XRP
$1.9
+4.59%
USDC
USDC
$0.9998
+0.01%
Solana
SOL
$125.64
+4.71%
TRON
TRX
$0.2799
+0.55%
Dogecoin
DOGE
$0.1310
+6.48%
Cardano
ADA
$0.3744
+5.75%
How to buy BTC
Bitget lists BTC – Buy or sell BTC quickly on Bitget!
Trade now
Become a trader now?A welcome pack worth 6200 USDT for new users!
Sign up now