
Dogecoin Breakdown Ahead? Analyst Flags 2022-Style Signal

By:Newsbtc
Dogecoin may be lining up for a deeper breakdown even if Bitcoin manages a short-term bounce, according to pseudonymous analyst VisionPulsed, who argues that a familiar 2022-style pattern is re-emerging across majors and memecoins.
In a video published December 16, the analyst frames the near-term setup around Bitcoin’s daily stochastic RSI, which is moving from overbought back toward oversold. Over the past two months, every such reset on the daily chart has coincided with fresh lows in price. This time, he says, the structure is slightly different — and that matters for how Dogecoin trades the next leg.
Dogecoin Bull Need To Watch Bitcoin’s Stochastic Reset
On Bitcoin, VisionPulsed notes that the daily stochastic RSI is now “approaching oversold” after a stretch at elevated levels. In October, November and early December, similar full cycles from overbought to oversold on the daily timeframe were accompanied by Bitcoin making new lows.
var rnd = window.rnd || Math.floor(Math.random()*10e6); var pid607465 = window.pid607465 || rnd; var plc607465 = window.plc607465 || 0; var abkw = window.abkw || ''; var absrc = 'https://servedbyadbutler.com/adserve/;ID=172179;size=0x0;setID=607465;type=js;sw='+screen.width+';sh='+screen.height+';spr='+window.devicePixelRatio+';kw='+abkw+';pid='+pid607465+';place='+(plc607465++)+';rnd='+rnd+';click=CLICK_MACRO_PLACEHOLDER'; document.write('
');
if (!window.AdButler){(function(){var s = document.createElement("script"); s.async = true; s.type = "text/javascript";s.src = "https://servedbyadbutler.com/app.js";var n = document.getElementsByTagName("script")[0]; n.parentNode.insertBefore(s, n);}());}
var AdButler = AdButler || {}; AdButler.ads = AdButler.ads || []; var abkw = window.abkw || ""; var plc366606 = window.plc366606 || 0; (function(){ var divs = document.querySelectorAll(".plc366606:not([id])"); var div = divs[divs.length-1]; div.id = "placement_366606_"+plc366606; AdButler.ads.push({handler: function(opt){ AdButler.register(172179, 366606, [728,90], "placement_366606_"+opt.place, opt); }, opt: { place: plc366606++, keywords: abkw, domain: "servedbyadbutler.com", click:"CLICK_MACRO_PLACEHOLDER" }}); })();
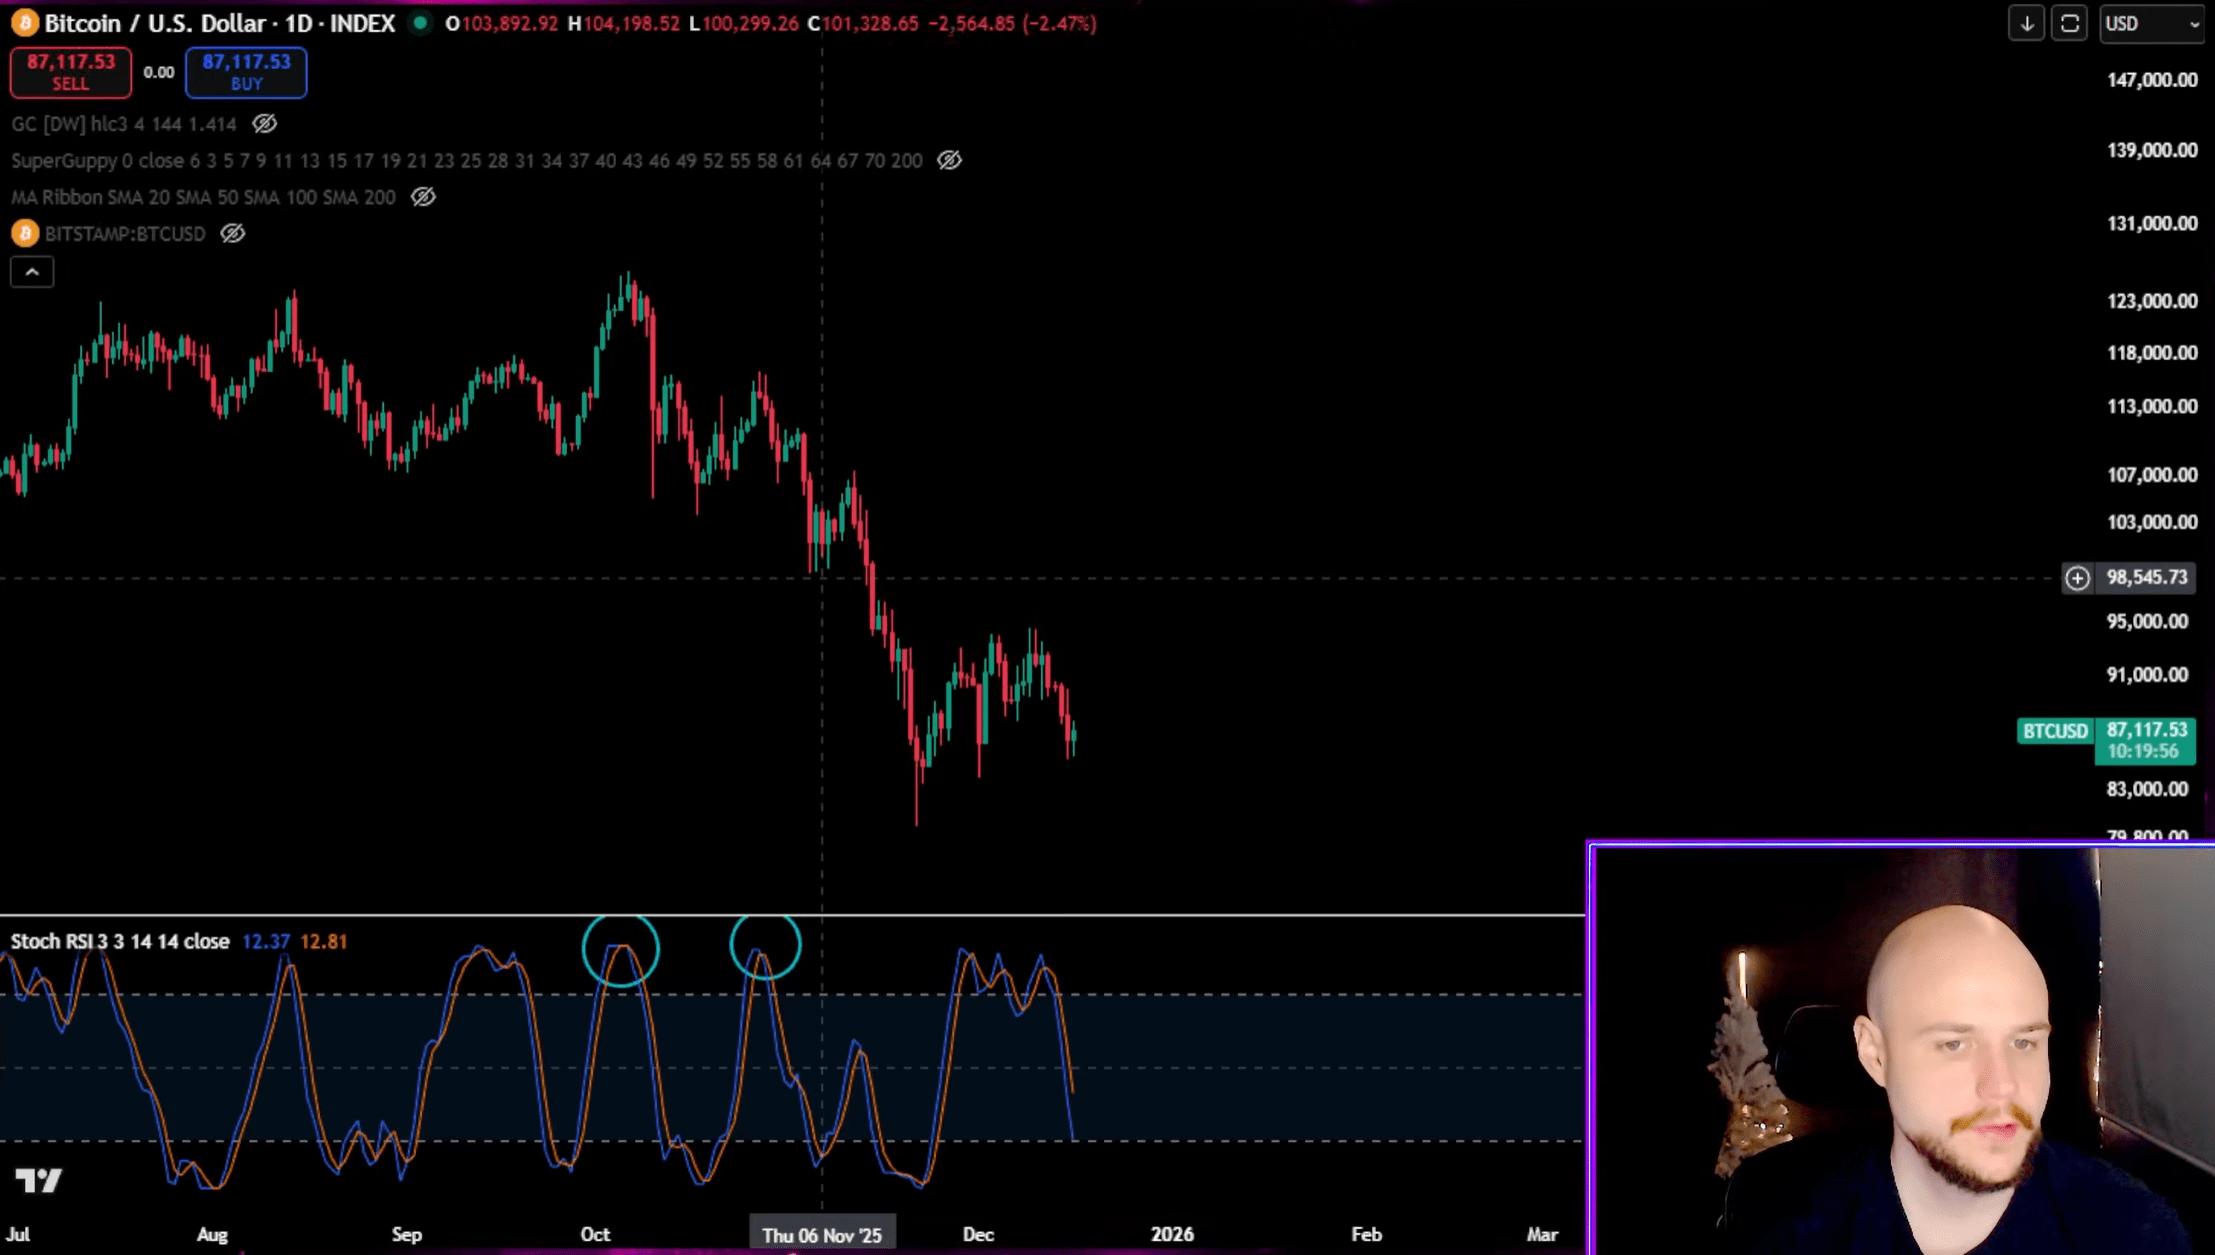 Bitcoin Stoch RSI, 1-day chart | Source: YouTube @VisionPulsed
“This is actually the first time that the stock RSI is going from overbought to oversold and we may not make a new low,” he says, emphasizing that it is still “too early” to call it. If price instead prints a higher low as the oscillator resets, he argues that would signal a short- to medium-term trend reversal rather than a macro regime change, opening the door for a relief rally.
“If we do see a higher low form on the price as the stock RSI resets, then you should get the green light for a relief rally,” he adds. If the current low breaks instead, the rally “is down to hell where you belong,” as he puts it, underscoring that the bullish case hinges on that higher-low structure holding on the daily chart.
Dogecoin, in his view, is where the setup turns dangerous. While Bitcoin is attempting to carve out a higher low, Dogecoin continues to print lower lows on the same timeframe. VisionPulsed links this to a similar divergence in 2022, when Doge bled lower throughout the month while Bitcoin quietly based and formed higher lows.
var rnd = window.rnd || Math.floor(Math.random()*10e6); var pid607472 = window.pid607472 || rnd; var plc607472 = window.plc607472 || 0; var abkw = window.abkw || ''; var absrc = 'https://servedbyadbutler.com/adserve/;ID=172179;size=0x0;setID=607472;type=js;sw='+screen.width+';sh='+screen.height+';spr='+window.devicePixelRatio+';kw='+abkw+';pid='+pid607472+';place='+(plc607472++)+';rnd='+rnd+';click=CLICK_MACRO_PLACEHOLDER'; document.write('
');
if (!window.AdButler){(function(){var s = document.createElement("script"); s.async = true; s.type = "text/javascript";s.src = "https://servedbyadbutler.com/app.js";var n = document.getElementsByTagName("script")[0]; n.parentNode.insertBefore(s, n);}());}
var AdButler = AdButler || {}; AdButler.ads = AdButler.ads || []; var abkw = window.abkw || ""; var plc452518 = window.plc452518 || 0; (function(){ var divs = document.querySelectorAll(".plc452518:not([id])"); var div = divs[divs.length-1]; div.id = "placement_452518_"+plc452518; AdButler.ads.push({handler: function(opt){ AdButler.register(172179, 452518, [728,90], "placement_452518_"+opt.place, opt); }, opt: { place: plc452518++, keywords: abkw, domain: "servedbyadbutler.com", click:"CLICK_MACRO_PLACEHOLDER" }}); })();
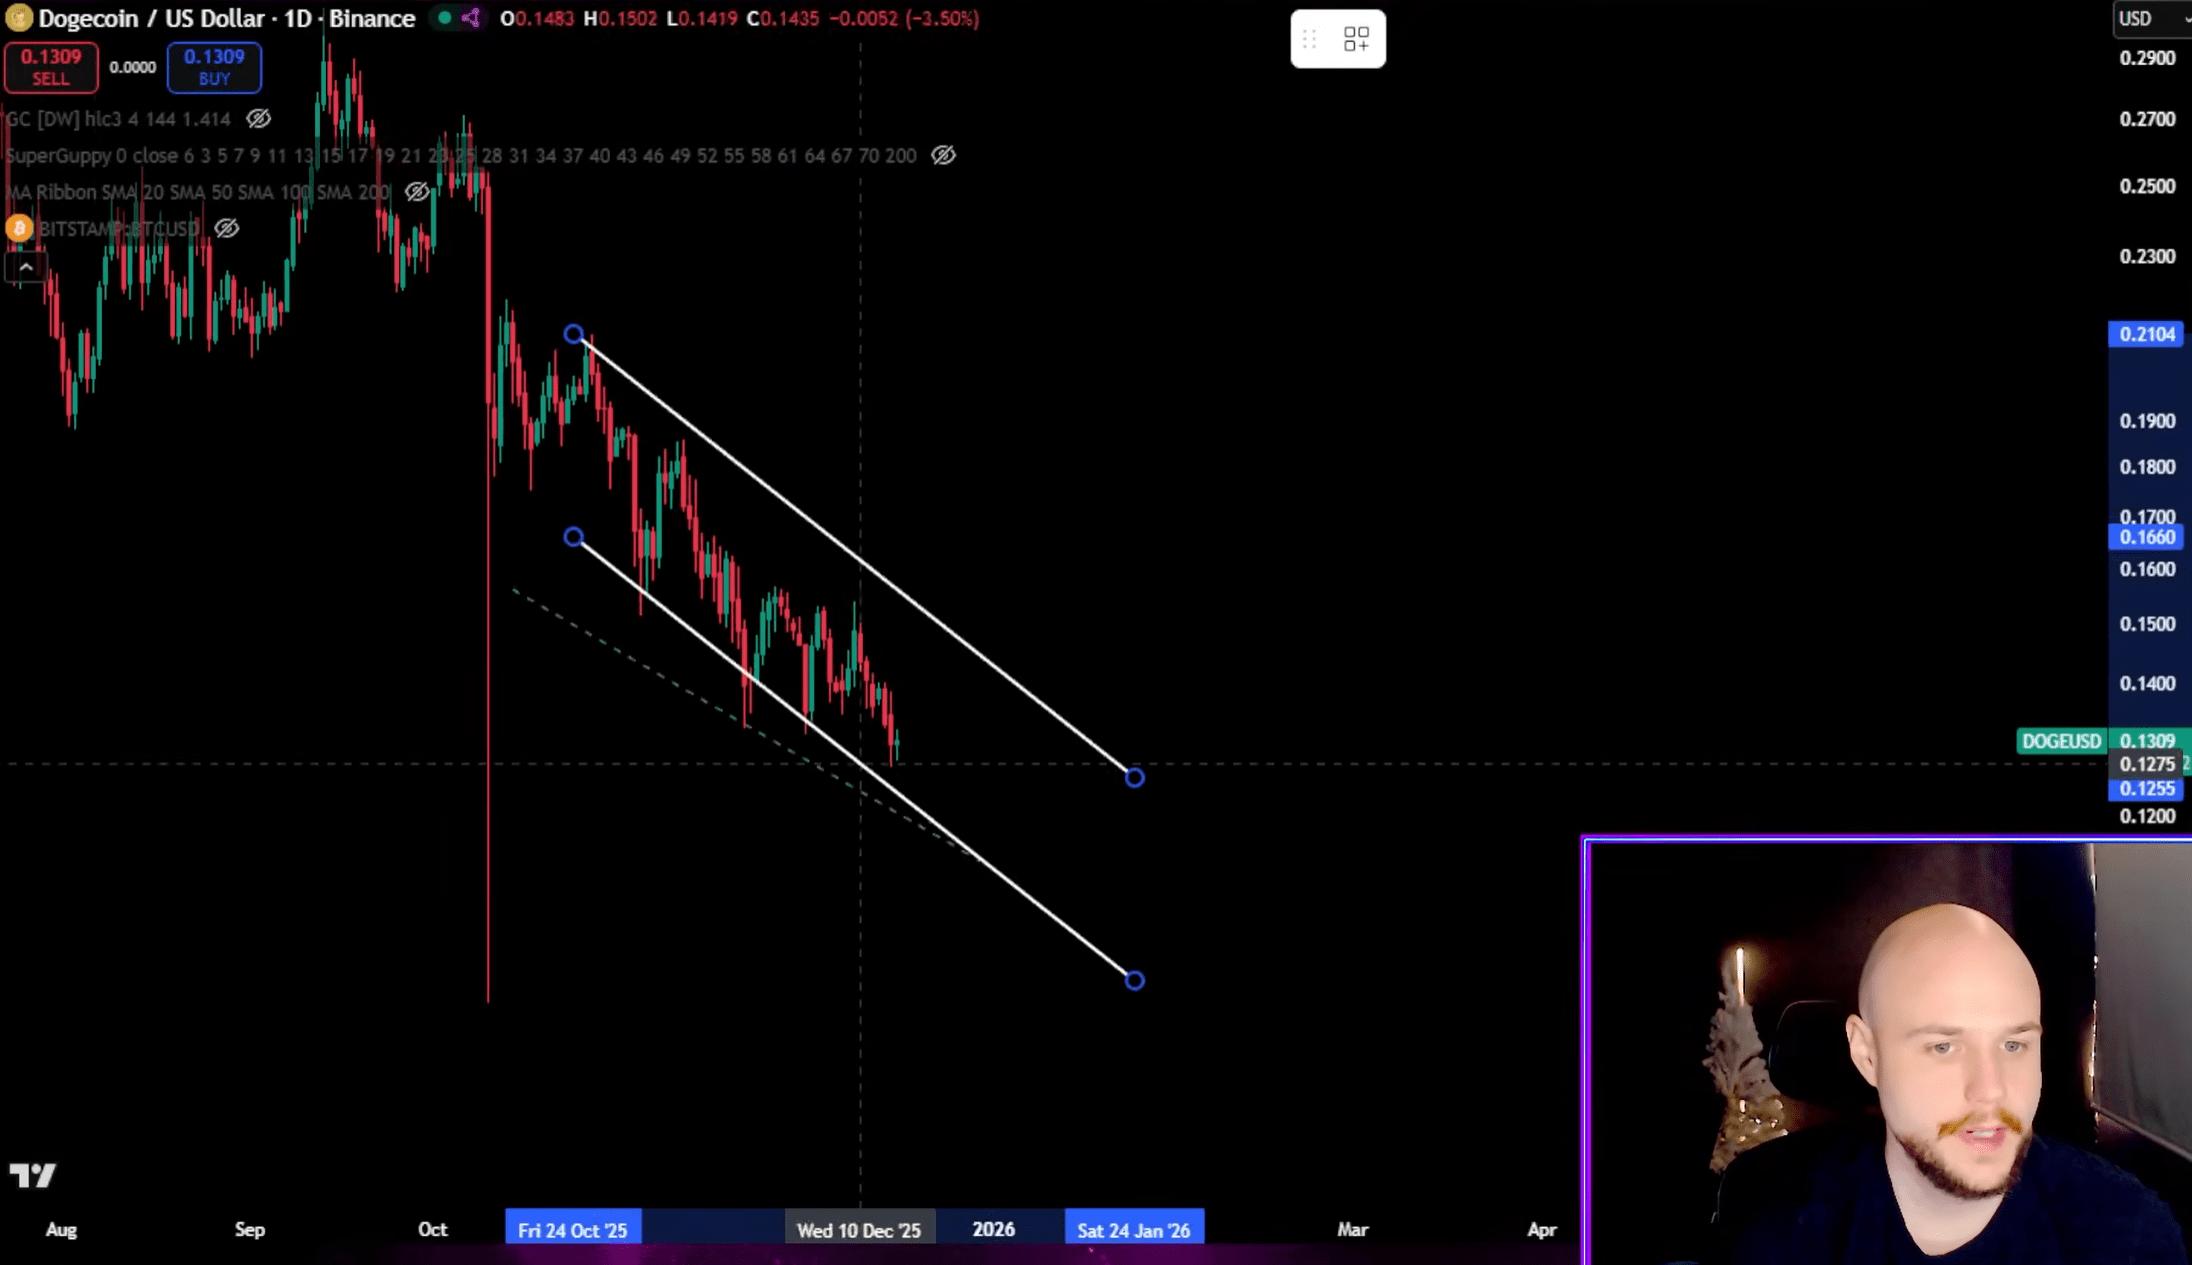 Dogecoin marks lower lows, 1-day chart | Source: YouTube @VisionPulsed
“Very similar to 2022,” he says, adding that Bitcoin is, as of the recording, making “a higher low even though Dogecoin is not.” That pattern, he argues, suggests Doge could still catch a relief move if Bitcoin rallies, but from a much weaker starting point.
How Low Can DOGE Price Go?
In such a scenario, he sketches a rally “probably somewhere up here to grab the peanut,” placing that so-called “peanut zone” roughly around the $0.20 area in January. He calls that level “probably your last chance to do whatever you’re going to do” before Dogecoin, in his base case, resumes its downtrend and heads “down to feed the pig pen” — his shorthand for a deeper capitulation move to new lows in the $0.05 to $0.06 area.
The base case for Dogecoin is a deeper retracement. He says. “We’re coming down to feed the little piggies. Oink oink.” Until Doge breaks its current downtrend, he sees “no reason to assume it’s bullish.”
var rnd = window.rnd || Math.floor(Math.random()*10e6); var pid607473 = window.pid607473 || rnd; var plc607473 = window.plc607473 || 0; var abkw = window.abkw || ''; var absrc = 'https://servedbyadbutler.com/adserve/;ID=172179;size=0x0;setID=607473;type=js;sw='+screen.width+';sh='+screen.height+';spr='+window.devicePixelRatio+';kw='+abkw+';pid='+pid607473+';place='+(plc607473++)+';rnd='+rnd+';click=CLICK_MACRO_PLACEHOLDER'; document.write('
');
if (!window.AdButler){(function(){var s = document.createElement("script"); s.async = true; s.type = "text/javascript";s.src = 'https://servedbyadbutler.com/app.js';var n = document.getElementsByTagName("script")[0]; n.parentNode.insertBefore(s, n);}());}
var AdButler = AdButler || {}; AdButler.ads = AdButler.ads || []; var abkw = window.abkw || ''; var plc452519 = window.plc452519 || 0; (function(){ var divs = document.querySelectorAll(".plc452519:not([id])"); var div = divs[divs.length-1]; div.id = "placement_452519_"+plc452519; AdButler.ads.push({handler: function(opt){ AdButler.register(172179, 452519, [728,90], 'placement_452519_'+opt.place, opt); }, opt: { place: plc452519++, keywords: abkw, domain: 'servedbyadbutler.com', click:'CLICK_MACRO_PLACEHOLDER' }}); })();

Dogecoin Hits Rare Weekly RSI Level Seen Only 4 Times In 11 Years
The timing, in his framework, is anchored on Bitcoin’s position inside the lower band of a 7–8 day Gaussian channel and the interaction of several moving averages. He notes that Bitcoin has already spent close to four weeks in this “peanut gallery” zone, versus roughly 63 days during the 2022 accumulation period.
If Bitcoin is still hovering near the upper range of the current structure by late January, he argues, “you’re pretty much recreating 2022,” which in his view would likely be followed by a capitulation leg lower.
A key signal to watch, he says, is the convergence of a white and a green moving average, which in the 2022 template marked the “point of no return before Bitcoin collapsed.” Those lines are now projected to converge in late January or early February.
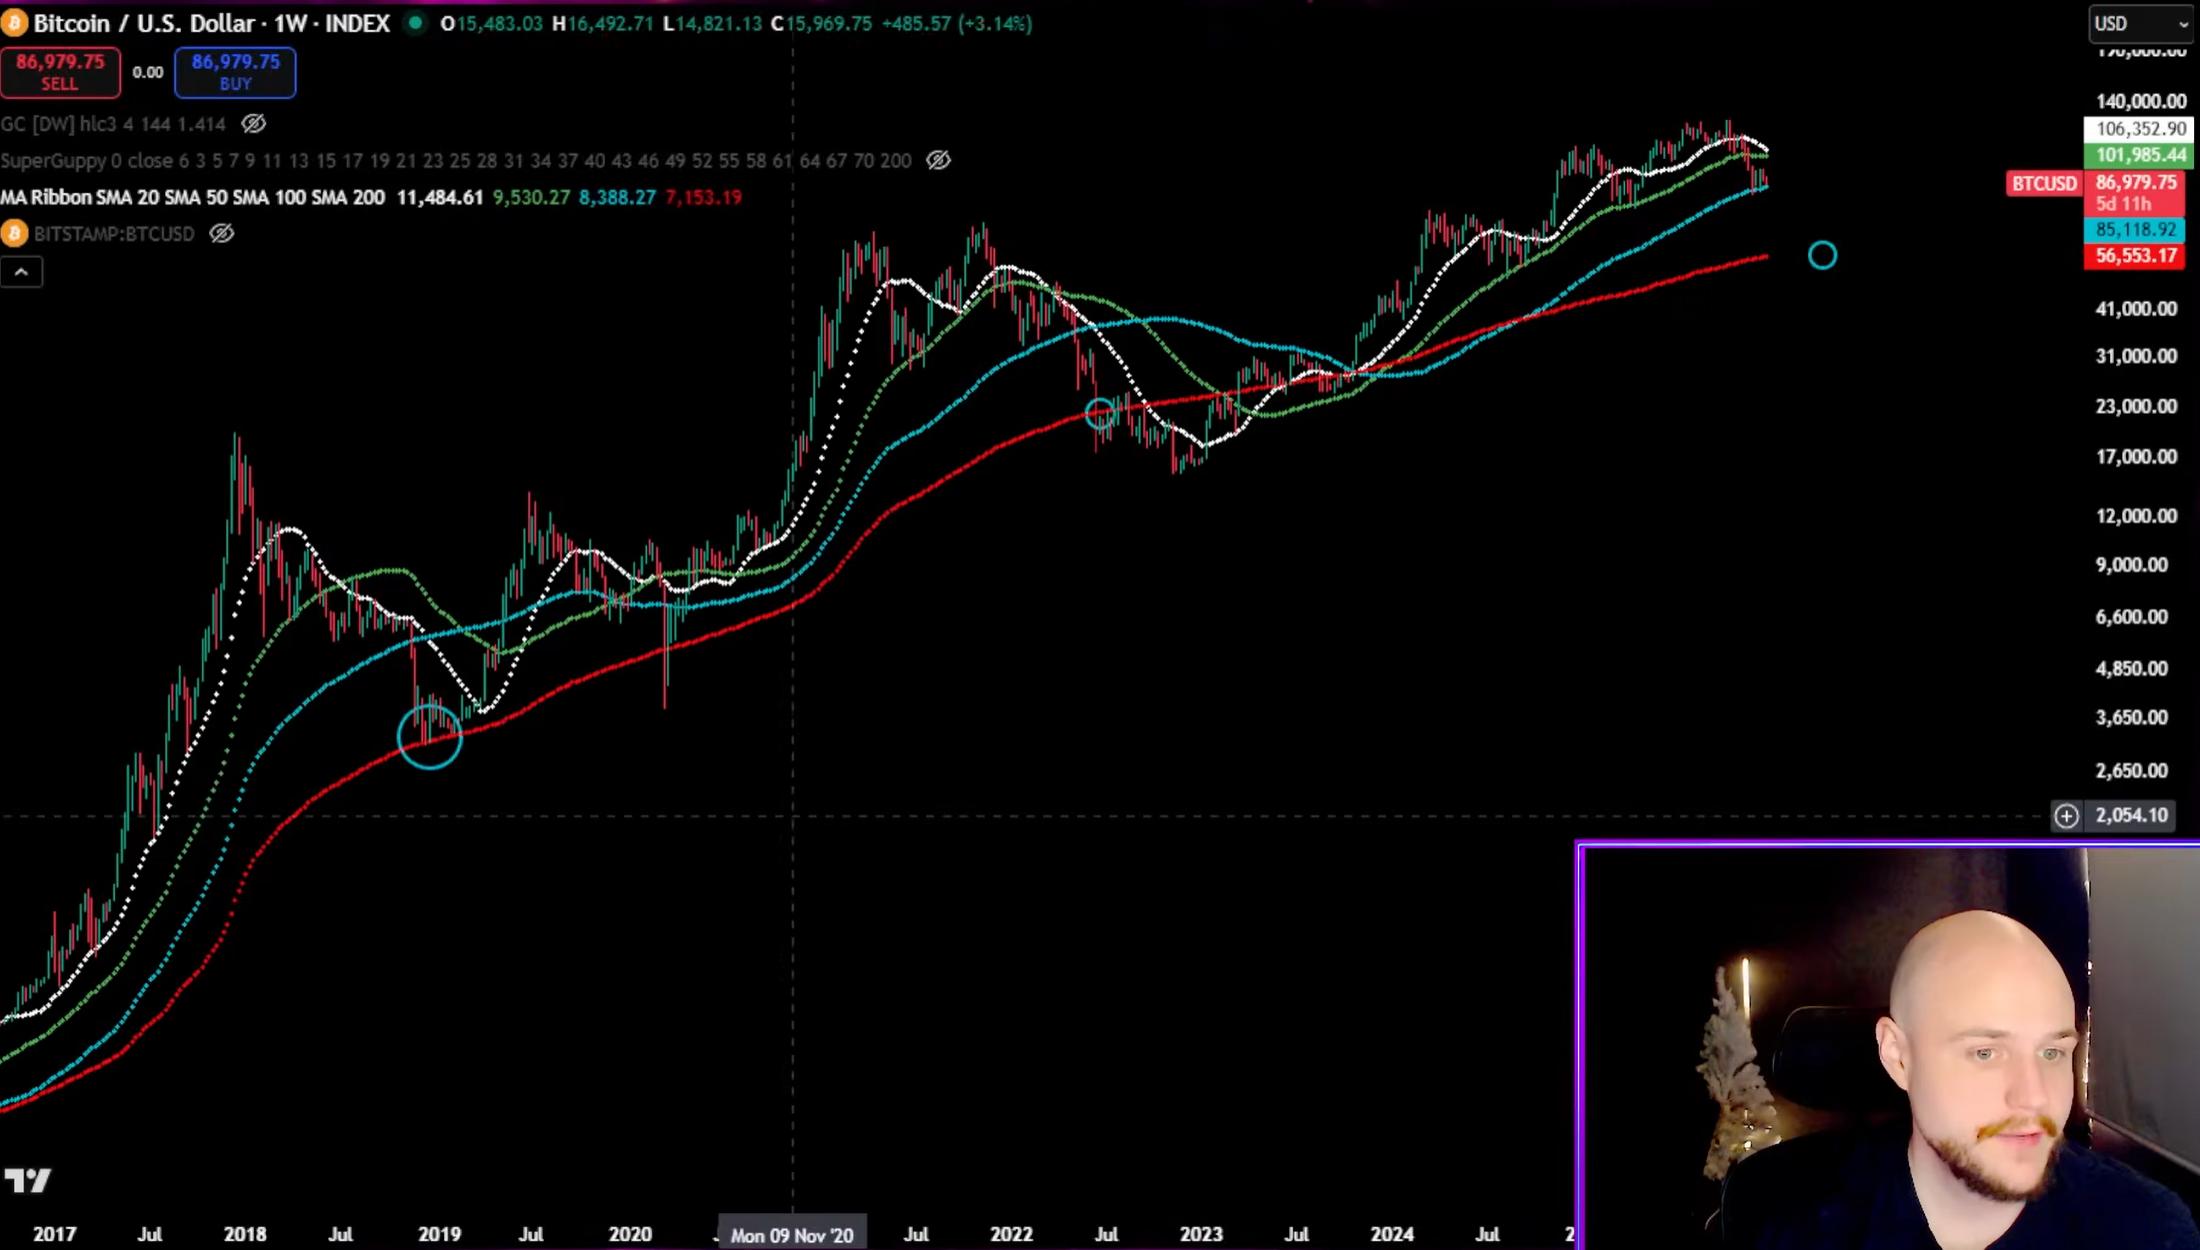 Bitcoin MA Ribbon SMA bands, 1-day chart | Source: YouTube @VisionPulsed
Once they meet, his base case is that Bitcoin gets “sent through the blue moving average” to test a red moving average in the $50,000–$60,000 zone as a minimum downside target. That, in his scenario, is when Dogecoin finally goes down to the $0.05 area.
At press time, DOGE traded at $0.12974.
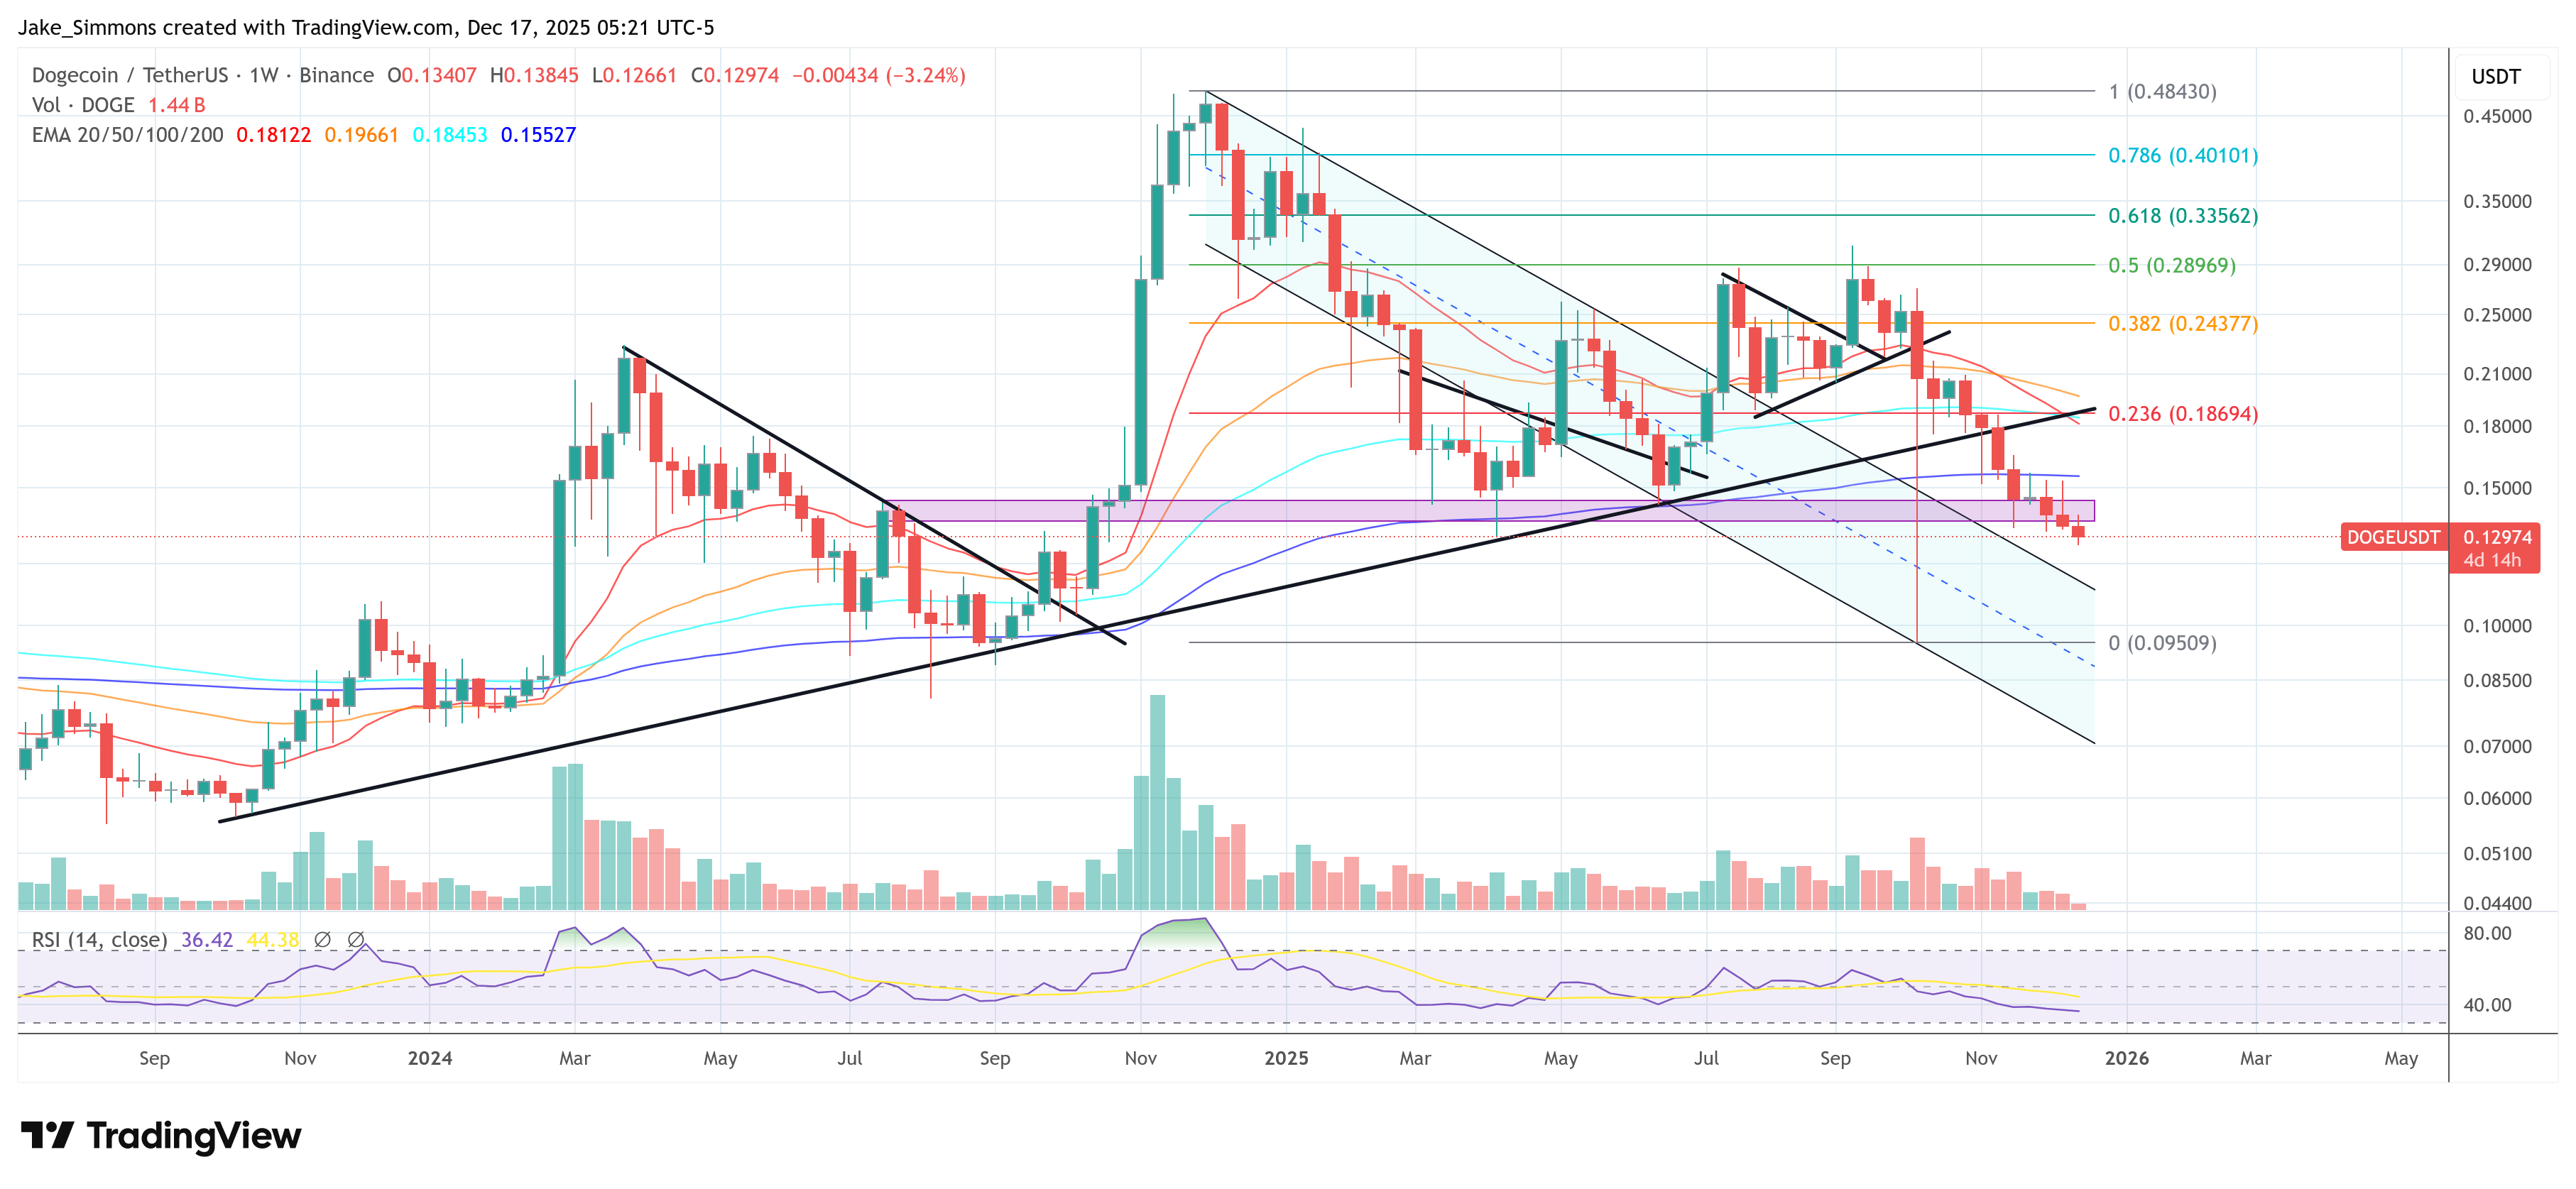 DOGE drops below key support zone, 1-week chart | Source:
DOGEUSDT on TradingView.com
DOGE drops below key support zone, 1-week chart | Source:
DOGEUSDT on TradingView.com
0
0
Disclaimer: The content of this article solely reflects the author's opinion and does not represent the platform in any capacity. This article is not intended to serve as a reference for making investment decisions.
PoolX: Earn new token airdrops
Lock your assets and earn 10%+ APR
Lock now!
You may also like
India lawmaker proposes tokenization bill to expand real estate access
Crypto.News•2025/12/17 23:45
Moody’s takes on stablecoins: New ratings spotlight redemption risks, not returns
Crypto.News•2025/12/17 23:30
Hyperliquid sees largest $11M liquidation during $526M market downturn
Cryptobriefing•2025/12/17 23:27

Best XRP Buy Zone? Analyst Breaks Down The Key Levels
Newsbtc•2025/12/17 23:18
Trending news
MoreCrypto prices
MoreBitcoin
BTC
$85,997.87
-1.89%
Ethereum
ETH
$2,824.79
-4.34%
Tether USDt
USDT
$0.9998
-0.01%
BNB
BNB
$841.05
-3.64%
XRP
XRP
$1.86
-3.55%
USDC
USDC
$1
+0.01%
Solana
SOL
$122.88
-4.41%
TRON
TRX
$0.2792
-0.50%
Dogecoin
DOGE
$0.1260
-4.26%
Cardano
ADA
$0.3661
-4.90%
How to buy BTC
Bitget lists BTC – Buy or sell BTC quickly on Bitget!
Trade now
Become a trader now?A welcome pack worth 6200 USDT for new users!
Sign up now