Bitget App
Trade smarter
Buy cryptoMarketsTradeFuturesEarnSquareMore
Pump.fun (PUMP) To Climb Higher — Key Bullish Pattern Breakout Suggest So!

Pump.fun (PUMP) To Climb Higher — Key Bullish Pattern Breakout Suggest So!

CoinsProbeCoinsProbe2025/12/07 22:06
By:Nilesh Hembade

Date: Sat, Dec 06, 2025 | 05:44 PM GMT

The broader cryptocurrency market has regained slight upward momentum, with both Bitcoin (BTC) and Ethereum (ETH) climbing back into the green by nearly 1% over the last several hours. This shift has allowed altcoins to stabilize, and Pump.fun (PUMP) is among the notable performers, posting over 6% intraday growth while developing a technical structure that hints at further upside potential.

Pump.fun (PUMP) To Climb Higher — Key Bullish Pattern Breakout Suggest So! image 0 
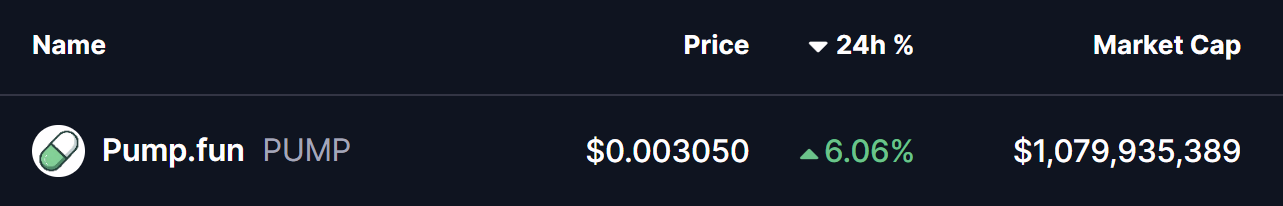
Source: Coinmarketcap

Harmonic Pattern Taking Shape

On the 4H chart, PUMP is framing a Bearish ABCD harmonic pattern, which—despite its name—is known for fueling a sharp CD-leg rally before price ever tests its completion zone.

The pattern initiated when PUMP surged from Point A ($0.002567) to the swing high at Point B, then retraced smoothly down to Point C near $0.002815. It was at this C-level that buyers stepped in, holding structure precisely where harmonic proportions align, confirming demand and strengthening bullish continuation probability.

Pump.fun (PUMP) To Climb Higher — Key Bullish Pattern Breakout Suggest So! image 1 
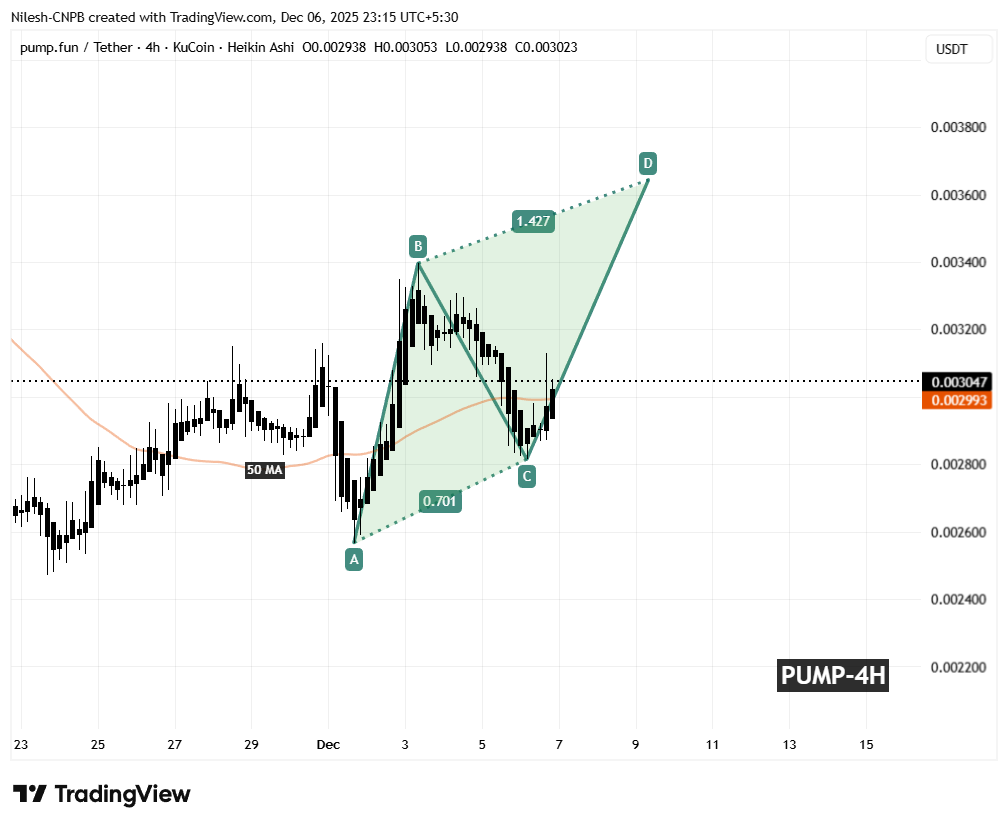
PUMP 4H Chart/Coinsprobe (Source: Tradingview)

Following the bounce, price has reclaimed the 50 MA and is already advancing toward the $0.003050 region. This MA recovery adds confidence that the CD-leg — typically the strongest acceleration phase within the harmonic sequence — is now underway.

What’s Next for PUMP?

If buyers sustain momentum above the 50 MA and avoid deeper pullback, PUMP could travel toward the 1.427 extension zone, aligning around $0.003644 — marking a potential 19% upside from current pricing.

However, traders should stay alert.
A drop back below the C-level at $0.002815 would slow bullish progression and could push price into temporary consolidation before any renewed breakout attempt. This wouldn’t invalidate the harmonic structure but could delay immediate upside movement.

For now, though, the setup remains constructive: Price reclaimed the MA, buyers defended structurally significant levels, and the pattern suggests a developing expansion phase rather than exhaustion.

0
0

Disclaimer: The content of this article solely reflects the author's opinion and does not represent the platform in any capacity. This article is not intended to serve as a reference for making investment decisions.

PoolX: Earn new token airdrops
Lock your assets and earn 10%+ APR
Lock now!

You may also like

Grasping the Factors Leading to Solana's Recent 50% Decline in Value

- Solana's 50% price drop in early 2025 stemmed from token unlocks, declining network activity, and the Libra meme token collapse. - Network metrics like active addresses (-40%) and TVL ($2.87B loss) revealed weakening ecosystem trust and liquidity. - Broader crypto market declines (Bitcoin to $86K) and macroeconomic risks accelerated Solana's sell-off amid rising trade war fears. - $500M liquidity migration to Ethereum and institutional ETF launches signaled cautious optimism despite ongoing volatility. -

Bitget-RWA2025/12/08 09:24
Grasping the Factors Leading to Solana's Recent 50% Decline in Value

Evaluating Solana’s Recent Price Fluctuations in Response to Network Enhancements and Changing Market Sentiment

- Solana's 2025 upgrades (Firedancer, Alpenglow) enhanced throughput, decentralization, and block finality, supporting mainstream financial operations. - Price volatility (19% drop to $132) reflected market fear, but whale accumulation and ETF launches signaled institutional confidence in long-term potential. - Macroeconomic pressures and regulatory scrutiny tempered speculative demand, while on-chain metrics showed diverging NVT ratios and declining retail participation. - Investors face a cautious opport

Bitget-RWA2025/12/08 09:08
Evaluating Solana’s Recent Price Fluctuations in Response to Network Enhancements and Changing Market Sentiment

Bitcoin Leverage Liquidation: Unseen Dangers Amid Crypto Market Fluctuations

- Q3 2025 saw $19B in Bitcoin leveraged trading liquidations, driven by cascading ADL mechanisms on major exchanges. - Overleveraged retail investors and DATCos amplified volatility through forced selling, exposing systemic fragility in crypto markets. - Behavioral biases like herd mentality and overconfidence worsened instability, with social media fueling impulsive trading decisions. - Institutions adopted risk-mitigation strategies while regulators tightened oversight, but gaps persist in monitoring opa

Bitget-RWA2025/12/08 08:46
© 2025 Bitget