Bitget App
Trade smarter
Buy cryptoMarketsTradeFuturesEarnSquareMore
Stellar (XLM) Testing Key Support — Could This Pattern Trigger an Rebound?

Stellar (XLM) Testing Key Support — Could This Pattern Trigger an Rebound?

CoinsProbeCoinsProbe2025/12/02 11:39
By:Nilesh Hembade

Date: Tue, Dec 02, 2025 | 03:45 AM GMT

The broader cryptocurrency market is off to a volatile start this week as the downturn has triggered over $518.83 million in liquidations across major exchanges, with long positions taking the biggest hit — more than $398.47 million wiped out.

This wave of volatility has pressured major altcoins , and Stellar (XLM) is among those struggling, down more than 8% on the weekly chart. But despite the deep selloff, XLM’s larger technical structure hints that a potential rebound may be forming right at a crucial level.

Stellar (XLM) Testing Key Support — Could This Pattern Trigger an Rebound? image 0 
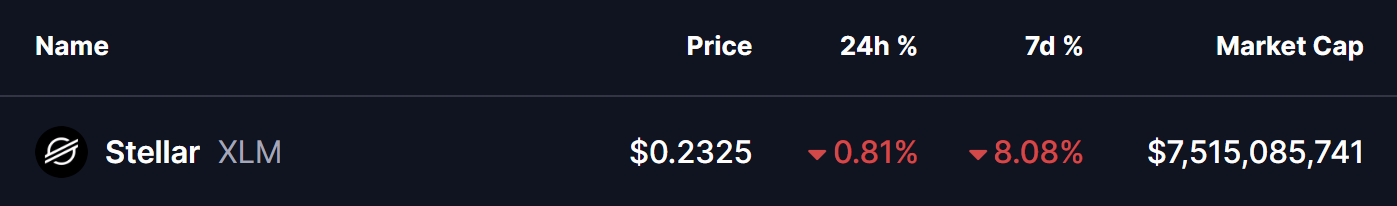
Source: Coinmarketcap

Descending Triangle in Play

On the weekly timeframe, XLM continues to trade inside a descending triangle pattern. This structure builds when sellers consistently lower the highs while buyers repeatedly defend a key horizontal support zone. While descending triangles often act as bearish continuation patterns, they can also produce strong countertrend rallies — especially when support holds for an extended period.

The current drop has pulled XLM back into its major demand region between $0.20 and $0.24. This area has served as a solid support base for several months, with each test prompting strong pushbacks from buyers. The repeated defense of this zone shows clear signs of accumulation and weakening selling pressure.

Stellar (XLM) Testing Key Support — Could This Pattern Trigger an Rebound? image 1 
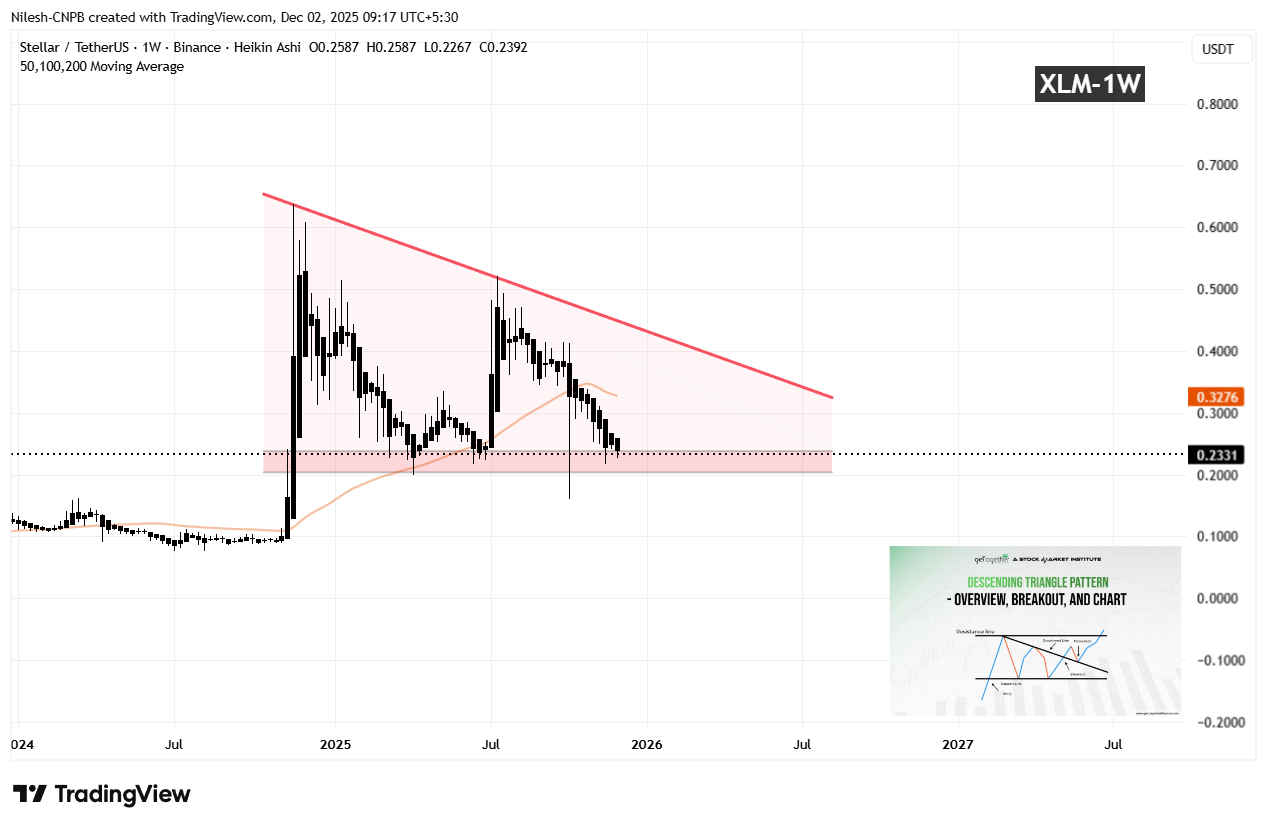
Stellar (XLM) Weekly Chart/Coinsprobe (Source: Tradingview)

XLM is also sitting below the 100-week moving average near $0.3276. Reclaiming this key moving average would be one of the earliest signals of a momentum shift in favor of the bulls.

What’s Next for XLM?

If buyers continue to defend the $0.20–$0.24 range and manage to push the price back above the 100-week MA, XLM could quickly regain strength. This would pave the way for a retest of the descending trendline resistance near $0.35 — a level that has capped upside movement for nearly a year.

A breakout above the trendline would be a major technical development and could signal the start of a broader reversal, especially if volume picks up on the breakout.

However, the risk remains on the downside. If XLM loses the $0.20 support with a firm close below the range, the descending triangle would break bearishly. In that scenario, the price could fall toward the next macro support around $0.13.

For now, the weekly close will be critical. As long as buyers continue to defend the foundation of the triangle, a rebound remains a realistic and technically supported possibility.

0
0

Disclaimer: The content of this article solely reflects the author's opinion and does not represent the platform in any capacity. This article is not intended to serve as a reference for making investment decisions.

PoolX: Earn new token airdrops
Lock your assets and earn 10%+ APR
Lock now!

You may also like

Hyperliquid’s Growing Influence in Crypto Trading: Enhancing Investor Access and Entry Methods in an Evolving Market

- Hyperliquid dominates 2025 crypto market with 73% DEX perpetual trading share via fee cuts, stablecoin integration, and institutional partnerships. - USDH stablecoin (backed by USD/Treasury) and HyperEVM infrastructure position it as "AWS of liquidity" for on-chain finance developers. - 78% user growth and 1.75M HYPE token unlock resilience highlight its scalability, though stablecoin regulations and market volatility pose risks.

Bitget-RWA2025/12/03 05:56
Hyperliquid’s Growing Influence in Crypto Trading: Enhancing Investor Access and Entry Methods in an Evolving Market

PENGU Token Price Rally: Examining Brief Upward Trends and Institutional Indicators Towards the End of 2025

- PENGU token surged past $0.0100 in late 2025, driven by Bitcoin's rebound and institutional inflows totaling $430,000. - Technical indicators show conflicting signals: overbought RSI (73.76) vs. positive MACD/OBV, with critical support at $0.009. - $66.6M team wallet outflows contrast with institutional accumulation, raising sustainability concerns despite short-term bullish momentum. - Macroeconomic factors like Fed policy and Bitcoin correlation amplify PENGU's volatility, complicating long-term price

Bitget-RWA2025/12/03 05:56
PENGU Token Price Rally: Examining Brief Upward Trends and Institutional Indicators Towards the End of 2025

LUNA Rises 1.13% Amid Progress on U.S. Lawmaker’s Stock Trading Ban

- LUNA rose 1.13% in 24 hours amid U.S. political pressure to ban congressional stock trading, despite an 82.66% annual decline. - Rep. Anna Paulina Luna advanced the bipartisan Restore Trust in Congress Act, which would prohibit lawmakers and families from trading individual stocks. - The bill faces bipartisan opposition over financial flexibility concerns but has 100+ supporters, including conservatives and progressives, seeking to close ethics loopholes. - Critics argue the 2012 STOCK Act lacks sufficie

Bitget-RWA2025/12/03 05:22
LUNA Rises 1.13% Amid Progress on U.S. Lawmaker’s Stock Trading Ban

BCH Rises 9.13% Over 24 Hours as Overall Market Trends Upward

- Bitcoin Cash (BCH) surged 9.13% in 24 hours, with 10.08% monthly and 37.01% annual gains, signaling sustained bullish momentum. - Analysts attribute the rise to BCH's utility in cross-border payments, low fees, and institutional interest as a Bitcoin layer-2 solution. - No immediate catalysts (regulatory shifts, partnerships) were identified, suggesting market sentiment and macro trends drive the rally. - Experts highlight BCH's structural strengths and active development, positioning it to outperform br

Bitget-RWA2025/12/03 05:22
BCH Rises 9.13% Over 24 Hours as Overall Market Trends Upward
© 2025 Bitget