HBAR Is Close to Losing Its Only Bullish Setup Despite The Price Rise — Here’s Why

HBAR price recovered almost 26% from its November 21 low near $0.12. The price is up about 4% in the last 24 hours, which looks like a decent short-term recovery. But the bounce doesn’t look convincing. The only bullish setup on the chart is weakening fast, and the indicators show fading strength rather than growing
HBAR price recovered almost 26% from its November 21 low near $0.12. The price is up about 4% in the last 24 hours, which looks like a decent short-term recovery.
But the bounce doesn’t look convincing. The only bullish setup on the chart is weakening fast, and the indicators show fading strength rather than growing support.
Cup-and-Handle Setup Is Weakening While Bull Power Drops
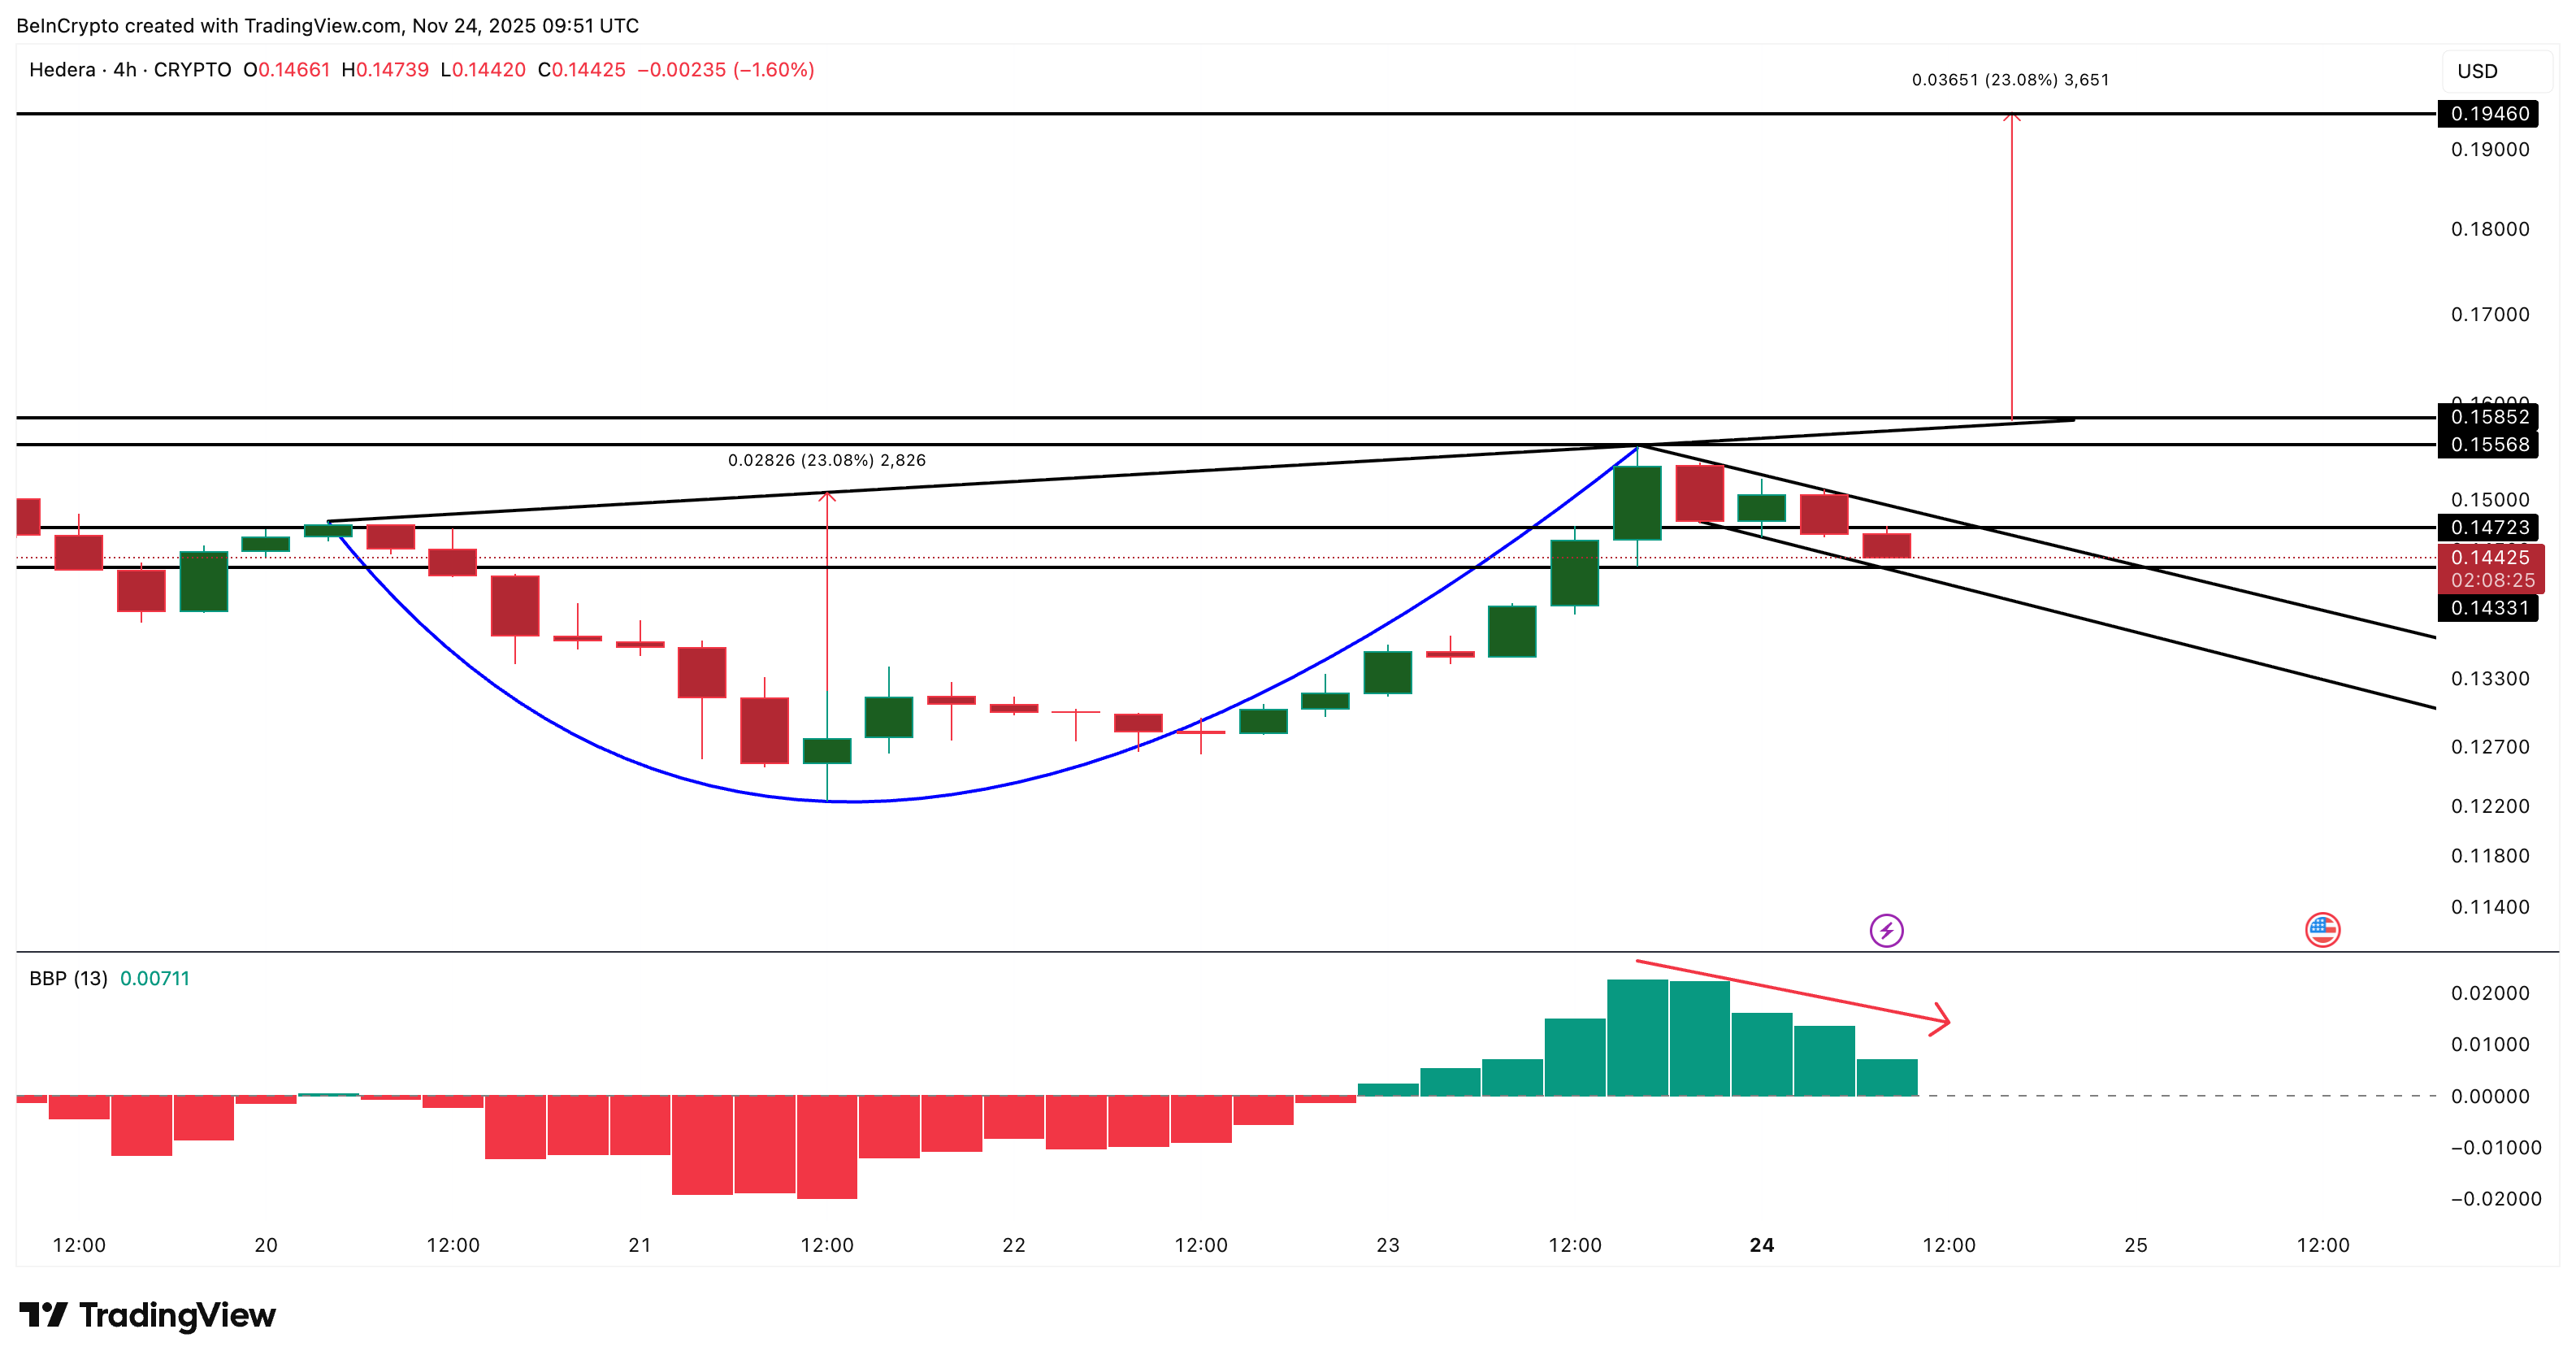
HBAR’s only short-term bullish case sits on the 4-hour chart. Between November 20 and November 23, the price created a cup-and-handle pattern. A cup-and-handle is a common bullish setup where price curves down and then up (the cup) before forming a small pullback (the handle). A breakout happens only when the price first closes above the handle’s top.
For HBAR, that breakout level is around $0.147.
A clean close above $0.158 breaks the cup itself and activates the pattern’s projected target near $0.194. Invalidation for this pattern lies under $0.143.
 HBAR Price Chart:
TradingView
HBAR Price Chart:
TradingView
Want more token insights like this? Sign up for Editor Harsh Notariya’s Daily Crypto Newsletter here.
But the issue is simple.
The Bull Bear Power (BBP) indicator, which compares market strength against average price, has been weakening since November 23. BBP is still positive, but it is sloping down, which means buyers are losing control right when the pattern needs momentum to break out.
This is normal during consolidation, but HBAR is losing strength too quickly. If the price falls under $0.143, the handle breaks to the downside. When that happens, the cup-and-handle setup collapses, and the only bullish trigger disappears.
Big Money Flow Isn’t Enough
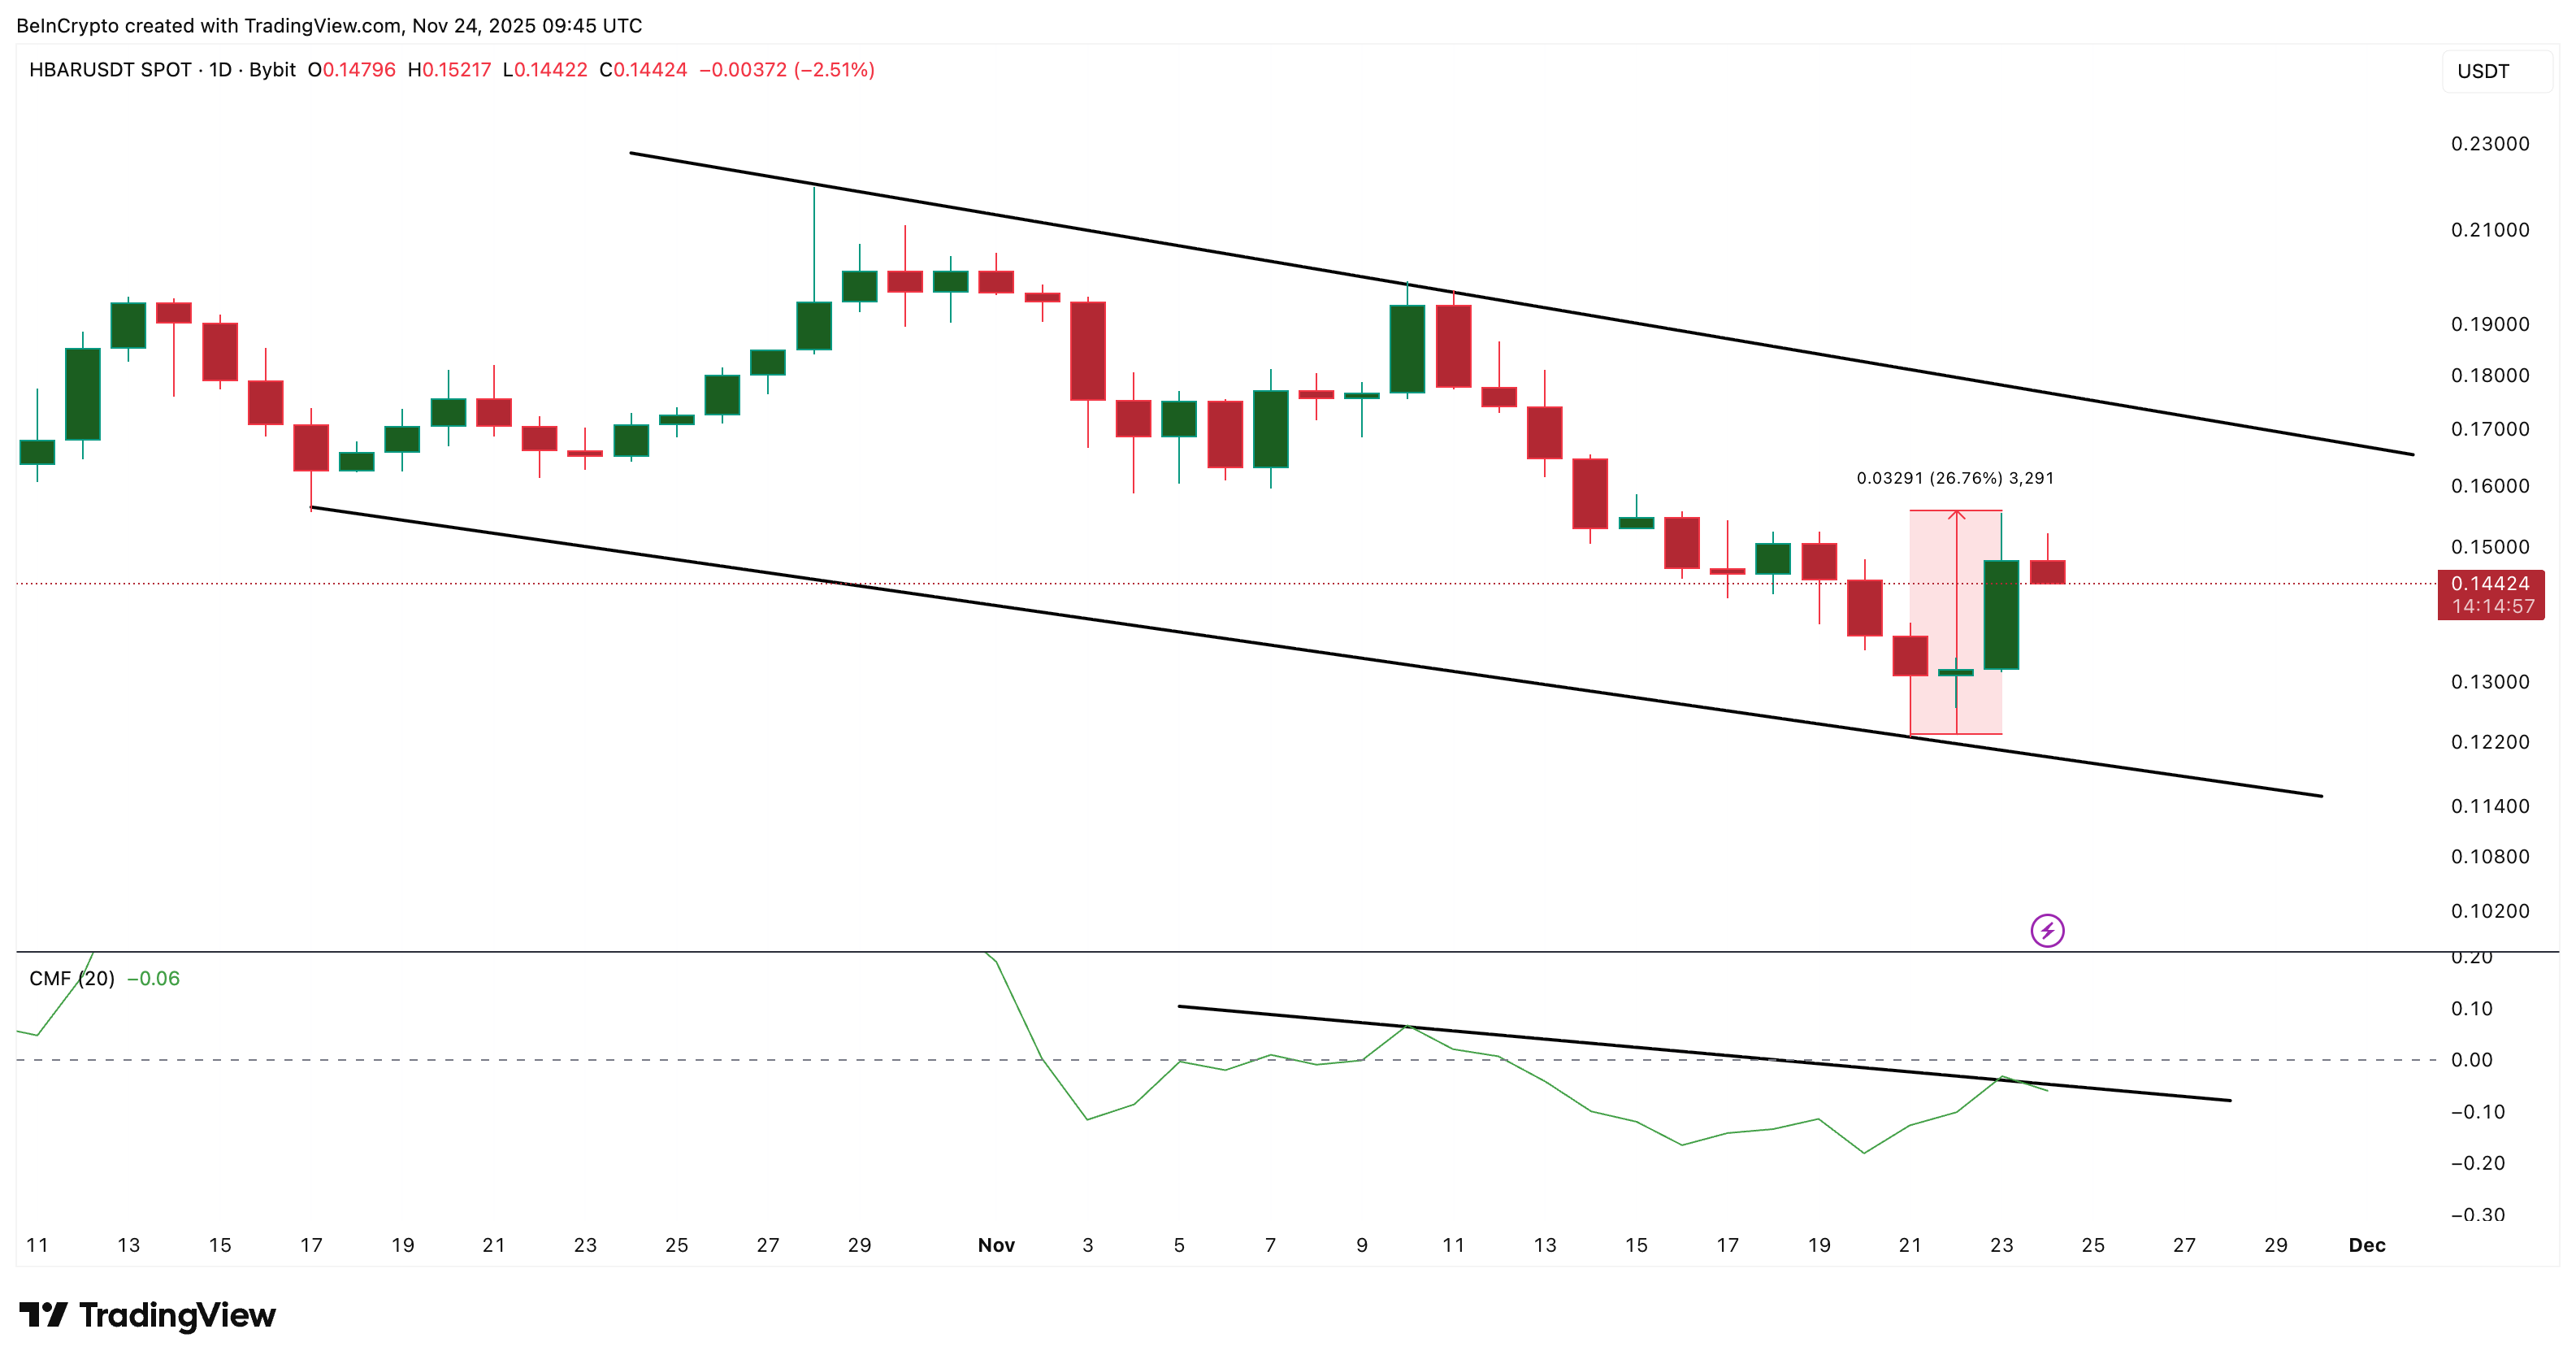
That weakness is also visible on the daily chart. HBAR is still trading inside a falling channel. A falling channel forms when both highs and lows drop in a straight, parallel path. Price touched the lower band of this channel on November 21 and bounced nearly 27%, but the move faded quickly.
The Chaikin Money Flow (CMF) explains why. CMF measures whether big money is flowing in or out of a token. It has been under its trendline since early November and has not crossed above zero. Big money is not supporting the bounce. A similar CMF failure on November 8–10 also led to a HBAR price drop.
 Bearish Money Flow:
TradingView
Bearish Money Flow:
TradingView
Until CMF breaks its trendline and moves above zero, every bounce is just a reaction, not a trend change. And that is why even the handle-breakout on the 4-hour is prone to failing.
HBAR Price Levels: The Bounce Is Still Weak Unless Key Breakouts Happen
The daily HBAR price action confirms the same weakness.
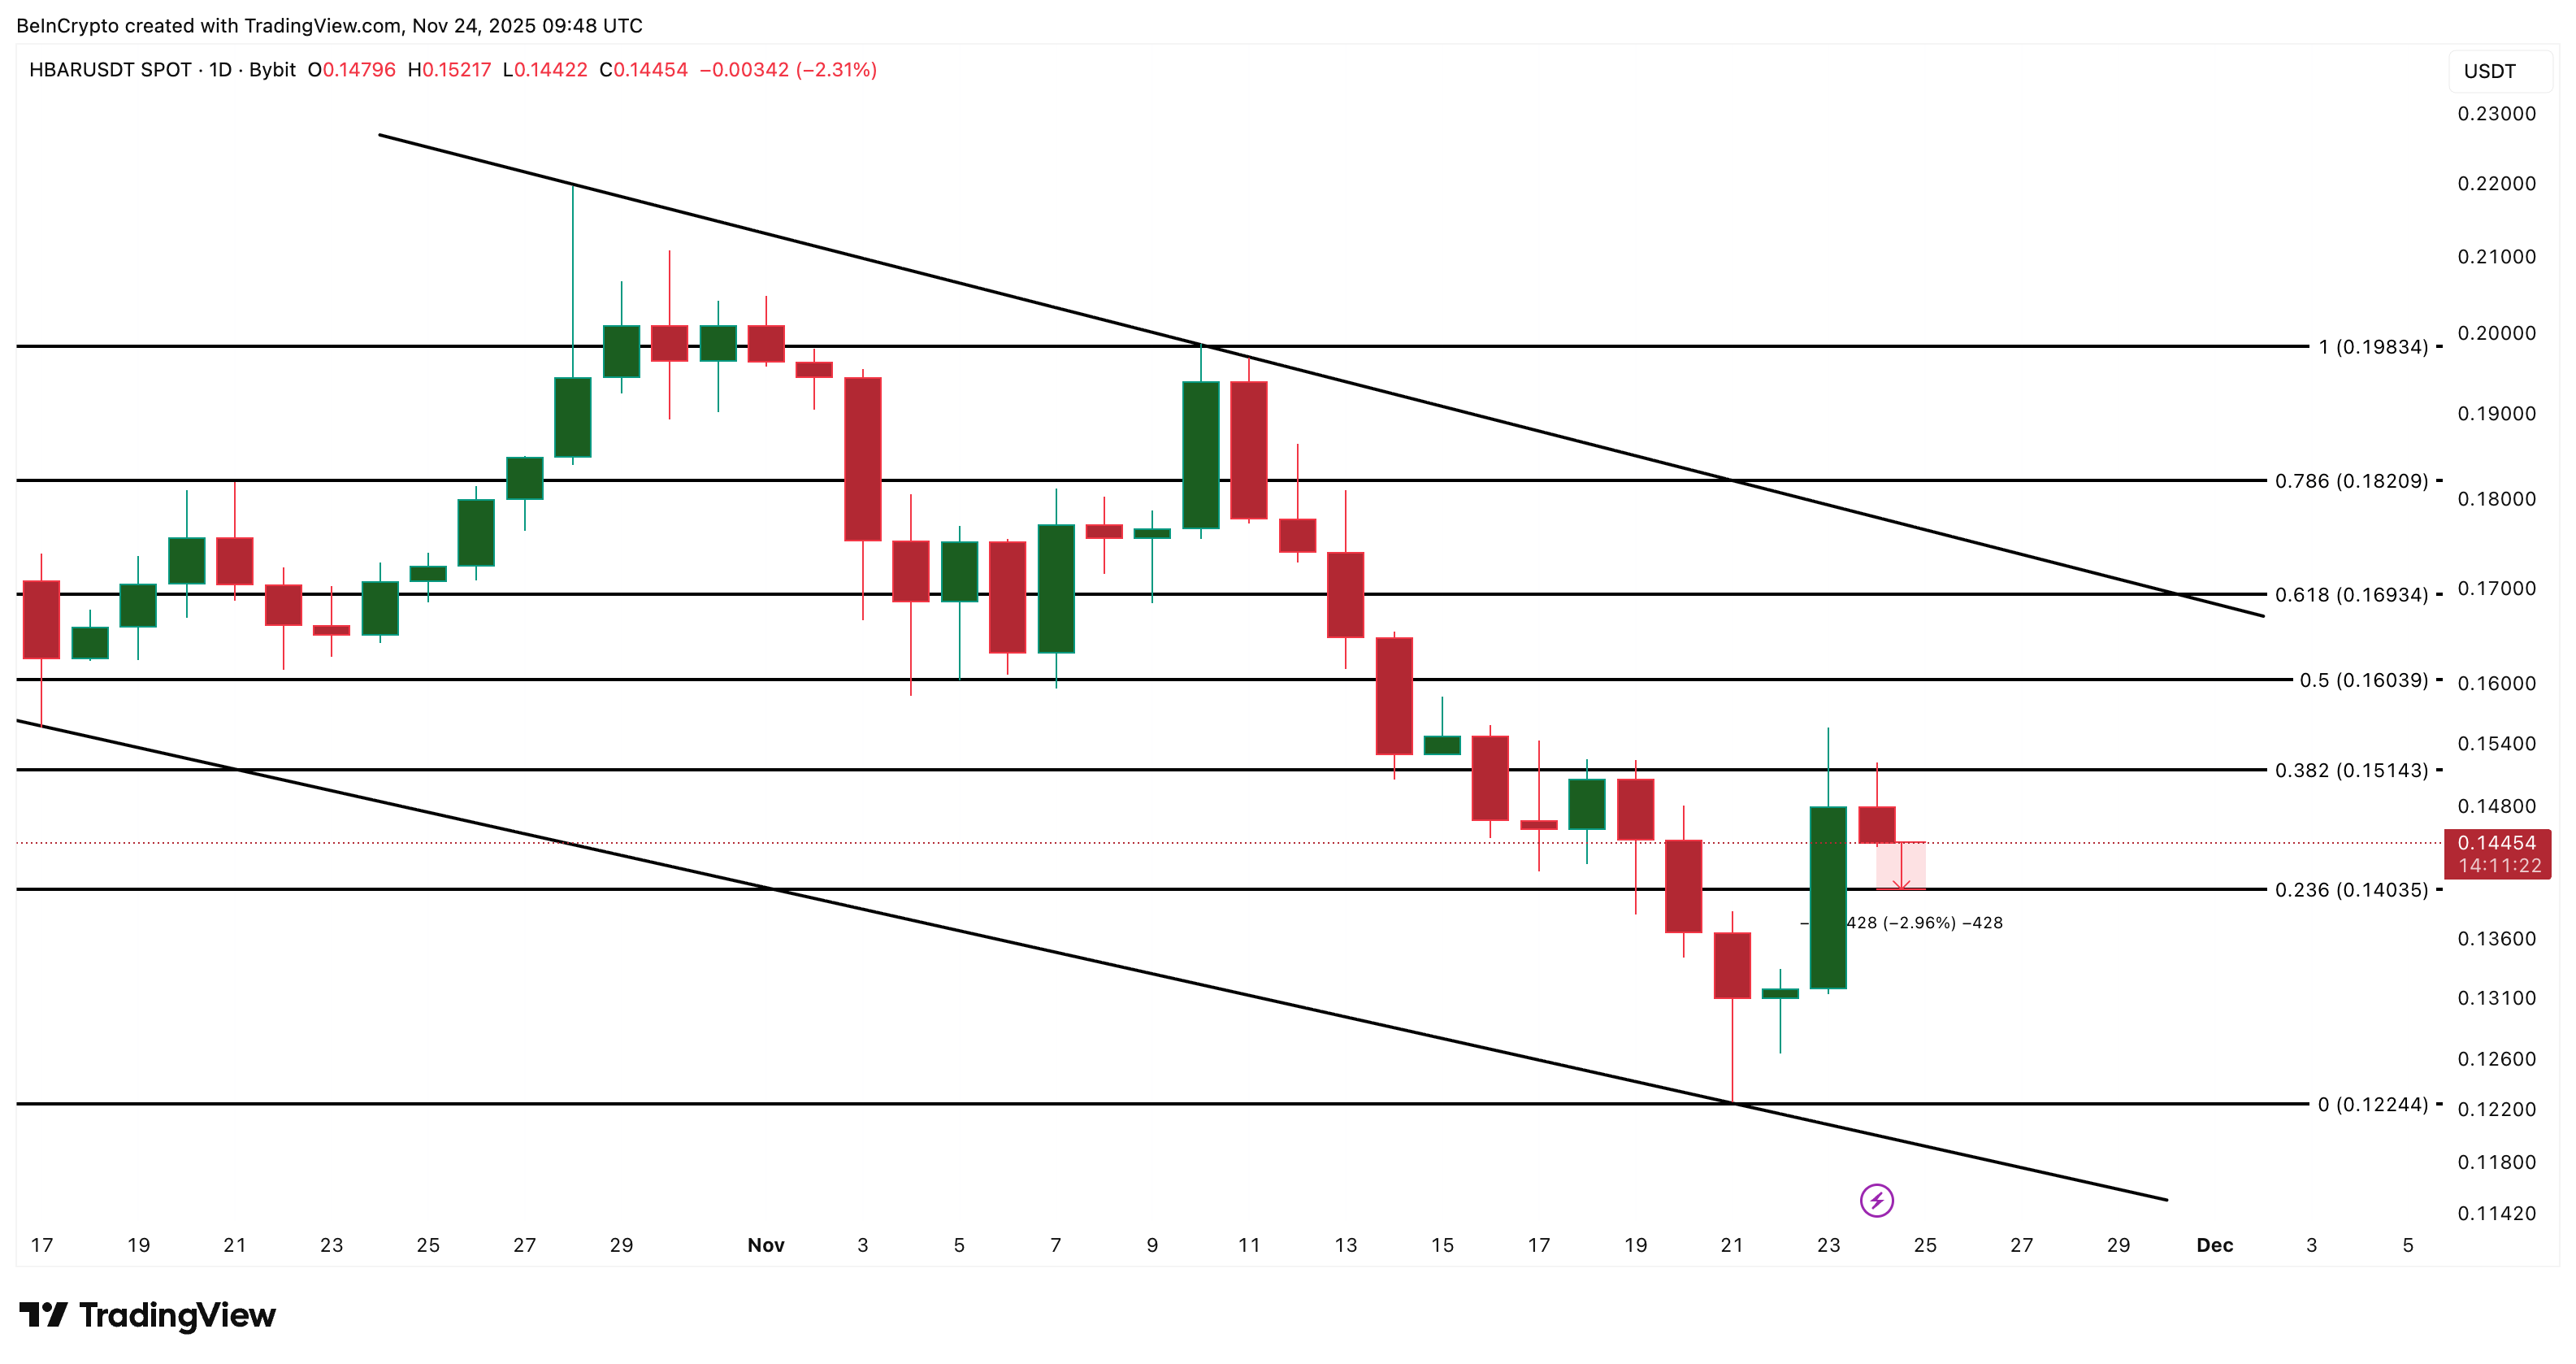
To continue higher, HBAR must break:
- $0.169 — resistance from the 0.618 retracement and the upper trendline of the falling channel.
- $0.182 — the stronger daily resistance
However, these levels come into the picture if the key cup-and-handle levels: $0.147 and $0.158, break first.
None of these breakouts looks likely unless CMF turns positive and bulls regain strength on the 4-hour chart.
The downside remains clearer than the upside. A daily close under $0.140 exposes $0.122, the November 21 low, and the most important support on the chart. A drop under $0.140 would also invalidate the cup-and-handle formation from earlier.
 HBAR Price Analysis:
TradingView
HBAR Price Analysis:
TradingView
One more detail matters: the lower trendline of the falling channel has only two clean touch points, which makes it structurally weaker. That means breaking below it would not require much effort if selling pressure increases again.
To invalidate the bearish setup, HBAR must reclaim $0.169 first and then $0.182. Moving above these levels flips the structure and opens a path toward $0.198, but this requires strong bull power and a full CMF recovery.
Read the article at BeInCryptoDisclaimer: The content of this article solely reflects the author's opinion and does not represent the platform in any capacity. This article is not intended to serve as a reference for making investment decisions.
You may also like
Ethereum News Update: Ethereum Faces $2,900 Test as $531 Million in Liquidations Threaten $10,000 Ambitions
- Ethereum faces $2,900-$2,700 volatility threshold, with $531M short liquidation risk above and $988M long liquidation risk below. - Bearish momentum intensifies as Binance outflows and $350M daily liquidations accelerate downward pressure below $2,800 support. - Long-term forecasts project $10,000 by 2030 driven by Ethereum 2.0 upgrades, deflationary mechanics, and institutional adoption like BitMine's $11.2B ETH stake. - Aztec's decentralized L2 launch and GENIUS Act regulatory proposals highlight Ether
Bitcoin News Today: "Presale Mania Meets Fed Announcements as Bitcoin Struggles to Break Past $90K Barrier"
- Bitcoin rose above $87,000 amid bets on Fed rate cuts, but faces $90K technical resistance amid liquidity gaps and sell walls. - Presale frenzy driven by limited-whitelist projects like Apeing Whitelist fuels FOMO, mirroring memecoin trends despite declining platform revenues. - Fed policy uncertainty and G20 geopolitical tensions shape markets , while crypto infrastructure faces risks from U.S. chip export policies. - Mixed traditional market performance highlights crypto's precarious path, with ETF inf
Ethereum News Today: Buterin Cautions That Institutional Control Could Undermine Ethereum's Decentralization
- Ethereum (ETH) hovers near key support levels amid institutional dominance and volatility, trading in a $2,500–$3,000 range as of November 21, 2025. - Vitalik Buterin warns institutional control risks decentralization, citing potential favoritism toward high-frequency trading infrastructure over individual node operators. - $1.5B in Ethereum ETF redemptions highlight shifting institutional sentiment, with BlackRock's ETHA Trust recording $53.7M outflows on November 20. - Technical analysis shows 70% prob
ZK Atlas Enhancement: Driving Layer 2 Expansion and Accelerating Institutional Embrace in 2025
- ZK Atlas Upgrade introduces Airbender, a RISC-V zkVM enabling 15,000+ TPS and $0.0001 per transaction, boosting Ethereum L2 scalability. - Modular ZKsync OS and Ethereum liquidity hub integration reduce gas fees by 70% since 2023, attracting Deutsche Bank and $3.5B TVL in ZK ecosystems. - Upcoming Fusaka upgrade (Dec 2025) targets 30,000 TPS while regulatory compliance and interoperability challenges remain key hurdles for institutional adoption.