PEPE Faces a Bearish Turning Point: Head-and-Shoulders Pattern or Triangle Optimism
- Pepe (PEPE) has plunged below $0.00000445, breaching key Fibonacci support and triggering bearish technical signals. - Analysts warn further declines to $0.00000185 are likely if the head-and-shoulders pattern confirms, though a symmetrical triangle hints at potential December upside. - Macroeconomic uncertainty and fading on-chain liquidity amplify risks, with TVL at $4.2M vs. $176M futures open interest showing speculative dominance. - Market awaits a rebound above $0.0000059 to stabilize, but bearish
Pepe (PEPE), a cryptocurrency inspired by memes, has dropped to its lowest point in several months as investors react to a significant breach of major support levels, sparking uncertainty over whether the token can recover or will continue to slide. Its price has slipped beneath $0.00000445,
Technical signals continue to point to selling pressure.
Recent price moves have led to comparisons with a classic head-and-shoulders chart pattern, which often signals a bearish reversal. Crypto analyst Ali Marteniz
The current chart structure for the token closely mirrors a head-and-shoulders formation, where a break below the neckline typically accelerates bearish momentum.

Broader economic uncertainty is also weighing on market sentiment.
Blockchain data highlights waning enthusiasm. The total value locked (TVL) in PEPE’s main decentralized exchange pool is $4.2 million, much less than the $176 million in futures open interest, showing that speculative activity dominates.
Traders are now watching to see if PEPE can reclaim the $0.00000479 mark (the 7-day simple moving average) to help stabilize its price.
With PEPE
Disclaimer: The content of this article solely reflects the author's opinion and does not represent the platform in any capacity. This article is not intended to serve as a reference for making investment decisions.
You may also like
Switzerland Postpones Crypto Tax Data Exchange to Meet Technological and International Requirements
- Switzerland delays crypto tax data sharing until 2027, aligning with global regulatory reevaluations amid evolving tech and market dynamics. - SGS acquires Australia's Information Quality to boost digital revenue, reflecting Swiss firms' expansion into tech-driven compliance solutions. - Canada's Alberta oil sands policy shift highlights governments prioritizing economic growth over strict climate regulations, mirroring Switzerland's approach. - BridgeBio's precision medicine and Aires' EMF solutions dem

Switzerland's Focus on Privacy Conflicts with International Efforts for Crypto Taxation
- Switzerland delays crypto tax data sharing with international partners until 2027, contrasting with global regulatory efforts to close offshore loopholes. - The U.S. advances implementation of the OECD's CARF framework, aiming to automate reporting on foreign crypto accounts by 2029. - CARF requires foreign exchanges to report U.S. account details, mirroring traditional tax standards and targeting crypto tax evasion. - Switzerland's privacy-focused stance highlights tensions between financial confidentia

Zcash News Update: Reliance Shifts Entirely to Zcash, Citing Privacy and Regulatory Alignment
- Reliance Global Group, a Nasdaq-listed fintech firm, shifted its entire crypto portfolio to Zcash (ZEC), divesting Bitcoin , Ethereum , and other major coins. - The strategic pivot, announced November 25, prioritizes Zcash's privacy-focused zk-SNARKs technology for institutional compliance and selective data disclosure. - Zcash's 1,200% 90-day price surge and Grayscale's ETF filing highlight growing institutional interest in privacy-centric assets. - The move reflects broader crypto industry trends towar
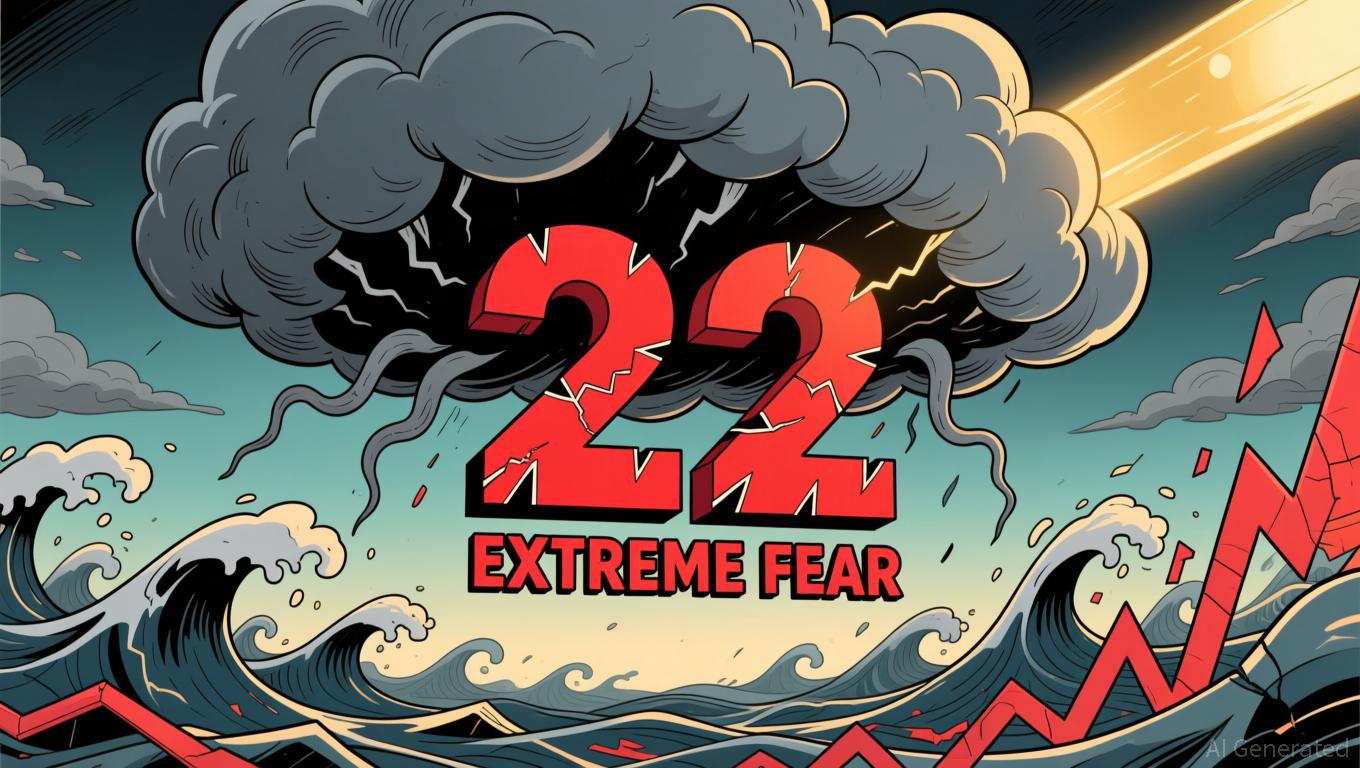
Bitcoin News Update: Bitcoin Fear Index Drops to 22 While Investors Look for Signs of Market Rebound
- Bitcoin Fear & Greed Index rose to 22 from 20, indicating slight easing of extreme fear but persistent bearish sentiment. - Bitcoin stabilized near $87,000 after hitting $80,553, yet remains below key resistance levels amid $3.5B ETF outflows. - Structural factors like leverage and liquidations drive selloffs, with ETF redemptions correlating to 3.4% price drops per $1B outflow. - Analysts note oversold technical indicators and waning retail capitulation as potential inflection points for near-term rebou