Date: Thu, Nov 20, 2025 | 11:10 AM GMT
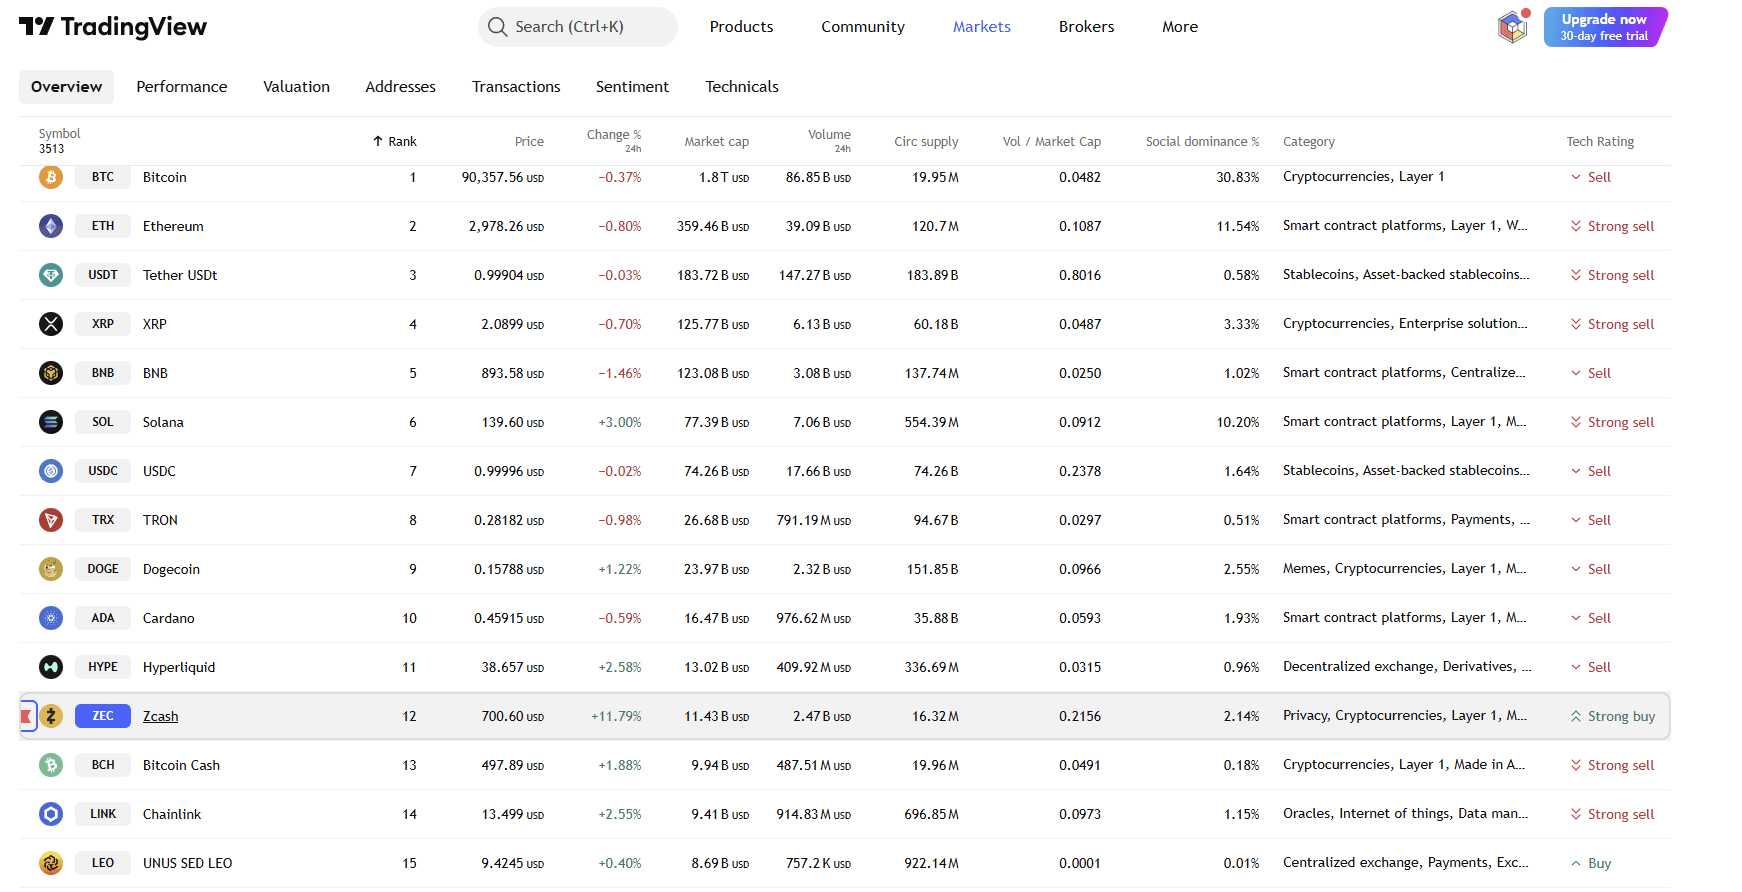
The crypto market is displaying mixed momentum as Bitcoin (BTC) trades slightly in green with a modest 0.50% climb, while Ethereum (ETH) remains under pressure with a 2% dip. This contrast has created a fragmented environment for altcoins , but some assets are beginning to turn positive — including Aptos (APT).
APT is trading with modest gains today, and more importantly, its 4H chart is now revealing a developing pattern that could shift momentum in favor of buyers. A potential harmonic formation is emerging, hinting that a bullish continuation may be closer than it appears.
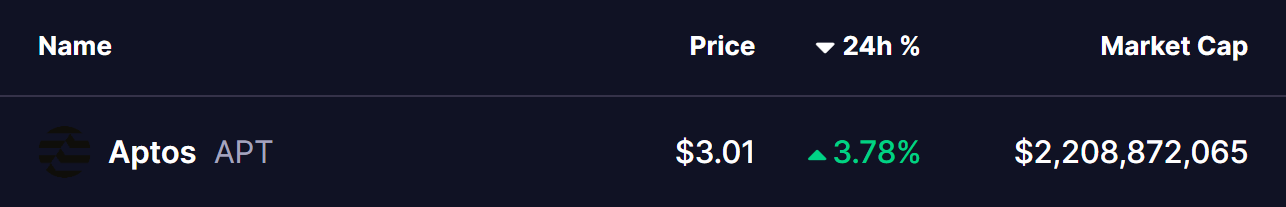 Source: Coinmarketcap
Harmonic Pattern Signals More Upside
On the 4H timeframe, APT is forming a Bearish Butterfly harmonic pattern — a structure known for driving the price higher until the final D-point completes. While the major reversal often takes place at the PRZ (Potential Reversal Zone), the journey toward that zone usually encourages a steady upward movement.
This pattern began at Point X near $3.6158, followed by a corrective decline into Point A. From there, APT rebounded into Point B around the 0.783 Fibonacci retracement level before dipping into Point C at $2.70, which now serves as the crucial support holding the entire structure together as the price is now climb to $3.01.
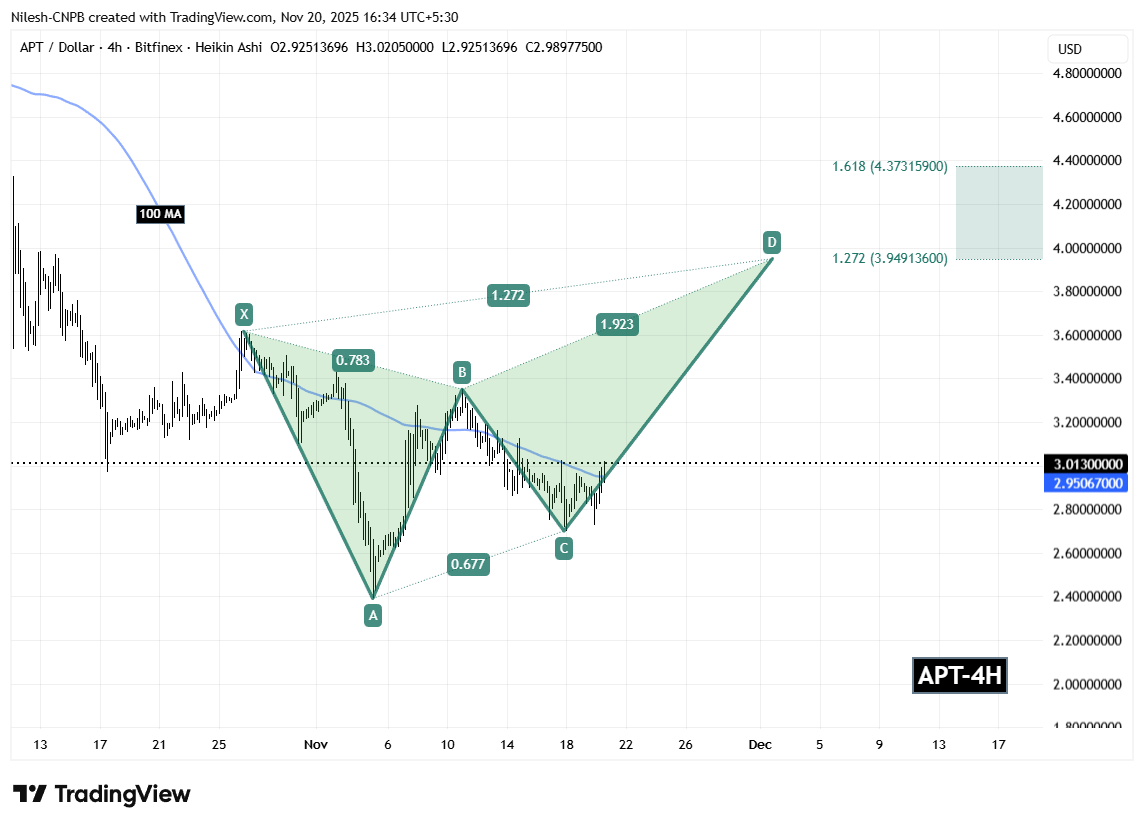 Aptos (APT) 4H Chart/Coinsprobe (Source: Tradingview)
A notable development strengthening this bullish scenario is APT’s successful reclaim of the 100 moving average around $2.95. This recovery is a strong technical signal, turning the 100 MA into dynamic support and improving the probability of sustained upside.
What’s Next for APT?
If bulls continue to defend the 100 MA and keep price above $2.95, APT could advance toward the PRZ between $3.9491 (1.27 Fibonacci extension) and $4.3731 (1.61 Fibonacci extension). This zone represents the completion area of the Bearish Butterfly pattern and the next major upside region traders are closely watching.
However, traders should also keep in mind that the PRZ often acts as a temporary profit-taking point, where price may hesitate or pull back before establishing a clearer long-term trend.
On the downside, if APT fails to hold above $2.70, the harmonic pattern risks invalidation. Such a breakdown could expose the token to deeper corrective ranges before any meaningful recovery attempt emerges.