
Bitcoin and Global Liquidity: Follower or Leader?

Bitcoin is declining, possibly as a "pre-emptive move" in response to tightening liquidity.
Bitcoin's decline may be a "pre-emptive move" in response to tightening liquidity.
Written by: Michael Nadeau
Translated by: Chopper, Foresight News
There are many tools and frameworks for understanding Bitcoin price trends, such as the equation of exchange (MV = PQ), stock-to-flow ratio, network value to transaction ratio, network value to Metcalfe's law ratio, realized price to market cap ratio, production cost, and so on.
But in the current market, everything ultimately comes down to liquidity conditions.
In this article, we will explore the relationship between Bitcoin and global liquidity: Is Bitcoin really "lagging" behind global liquidity?
Bitcoin and Global Liquidity
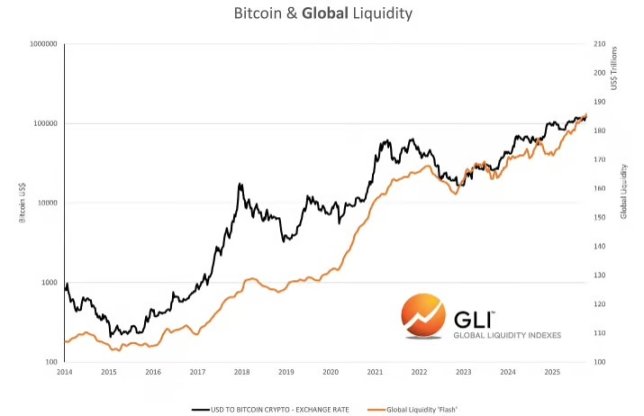
Source: Global Liquidity Indexes
According to research by Global Liquidity Indexes: "Historical data shows that changes in liquidity often trigger changes in risk asset prices, with a lag of about three months. Specifically, after global liquidity increases, risk assets usually perform well; while a decrease in liquidity often signals weak asset price trends."
In addition, Raoul Pal of Global Macro Investor states that global liquidity can explain 90% of Bitcoin's price volatility.
So what does the current data show?
- The three-month annualized growth rate of global liquidity is 10.2%;
- The annual growth rate of global liquidity is currently 6%.
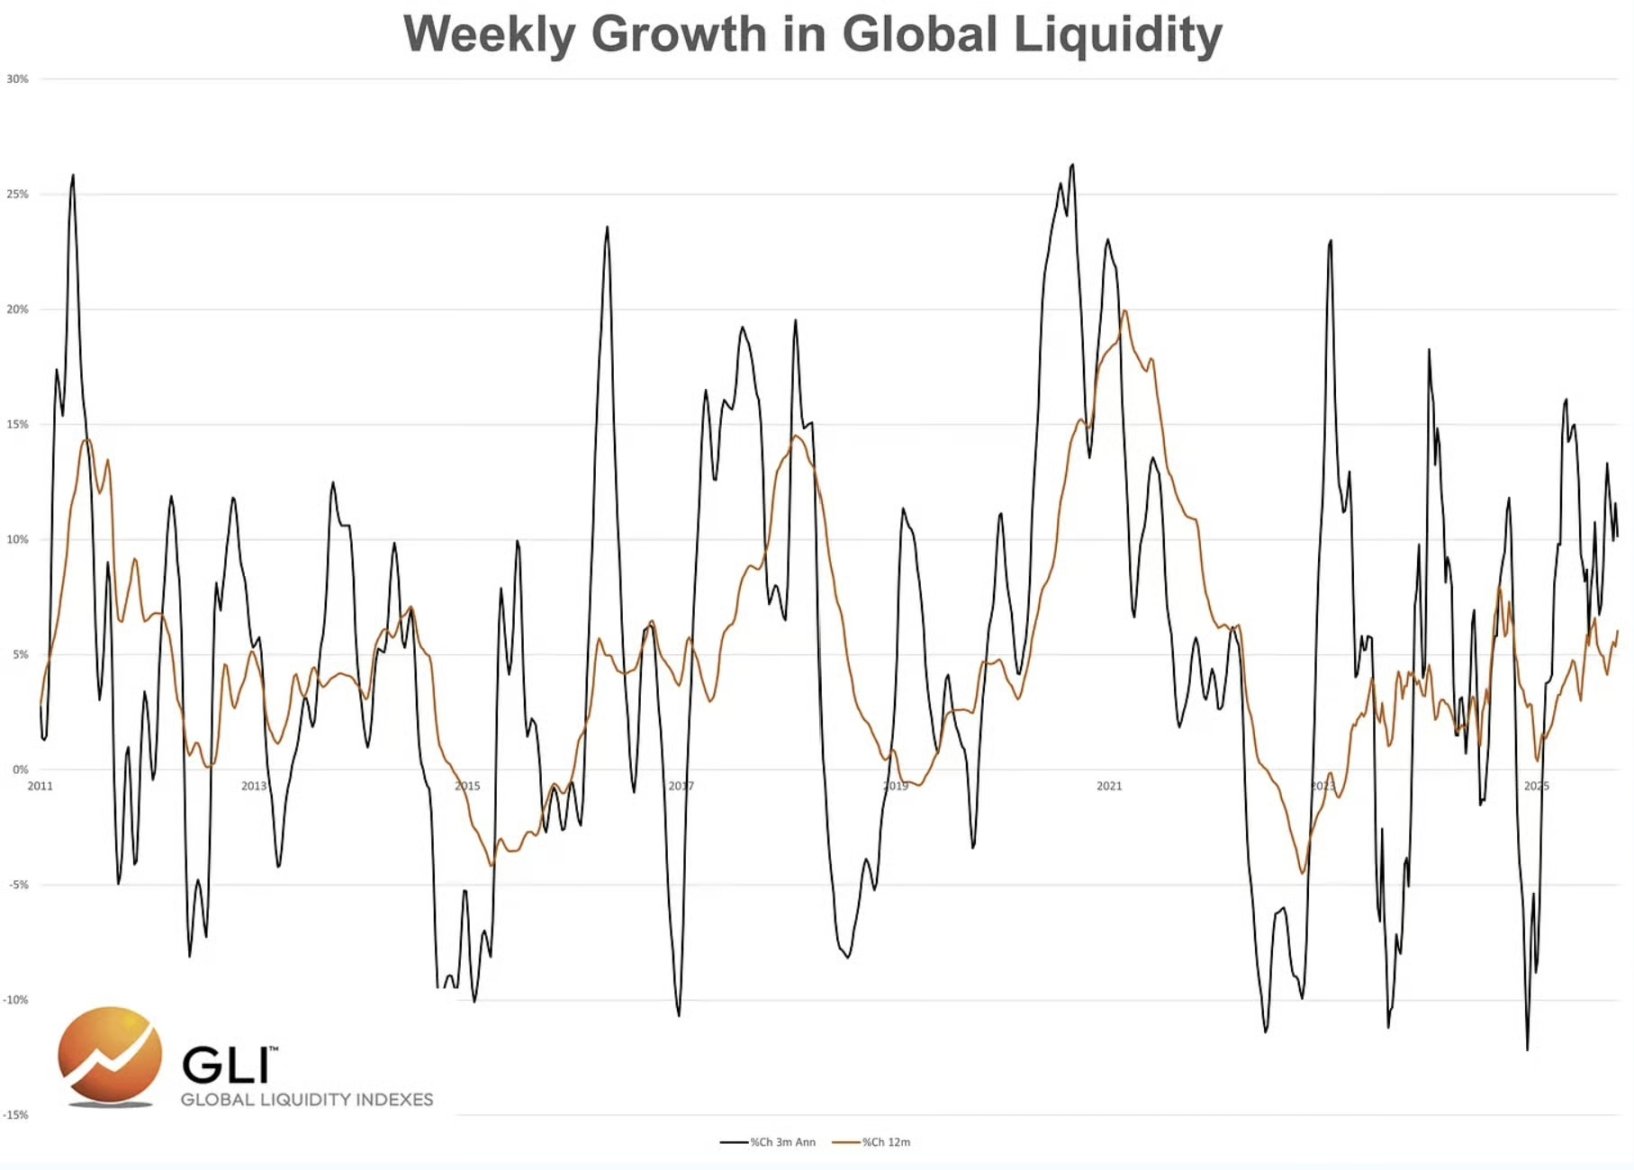
Source: Global Liquidity Indexes
According to this data and logic, Bitcoin should continue to rise, right?
From the data and conventional narrative, that seems to be the conclusion. But in the previous two cycles, global liquidity continued to expand for quite some time after Bitcoin reached its peak.
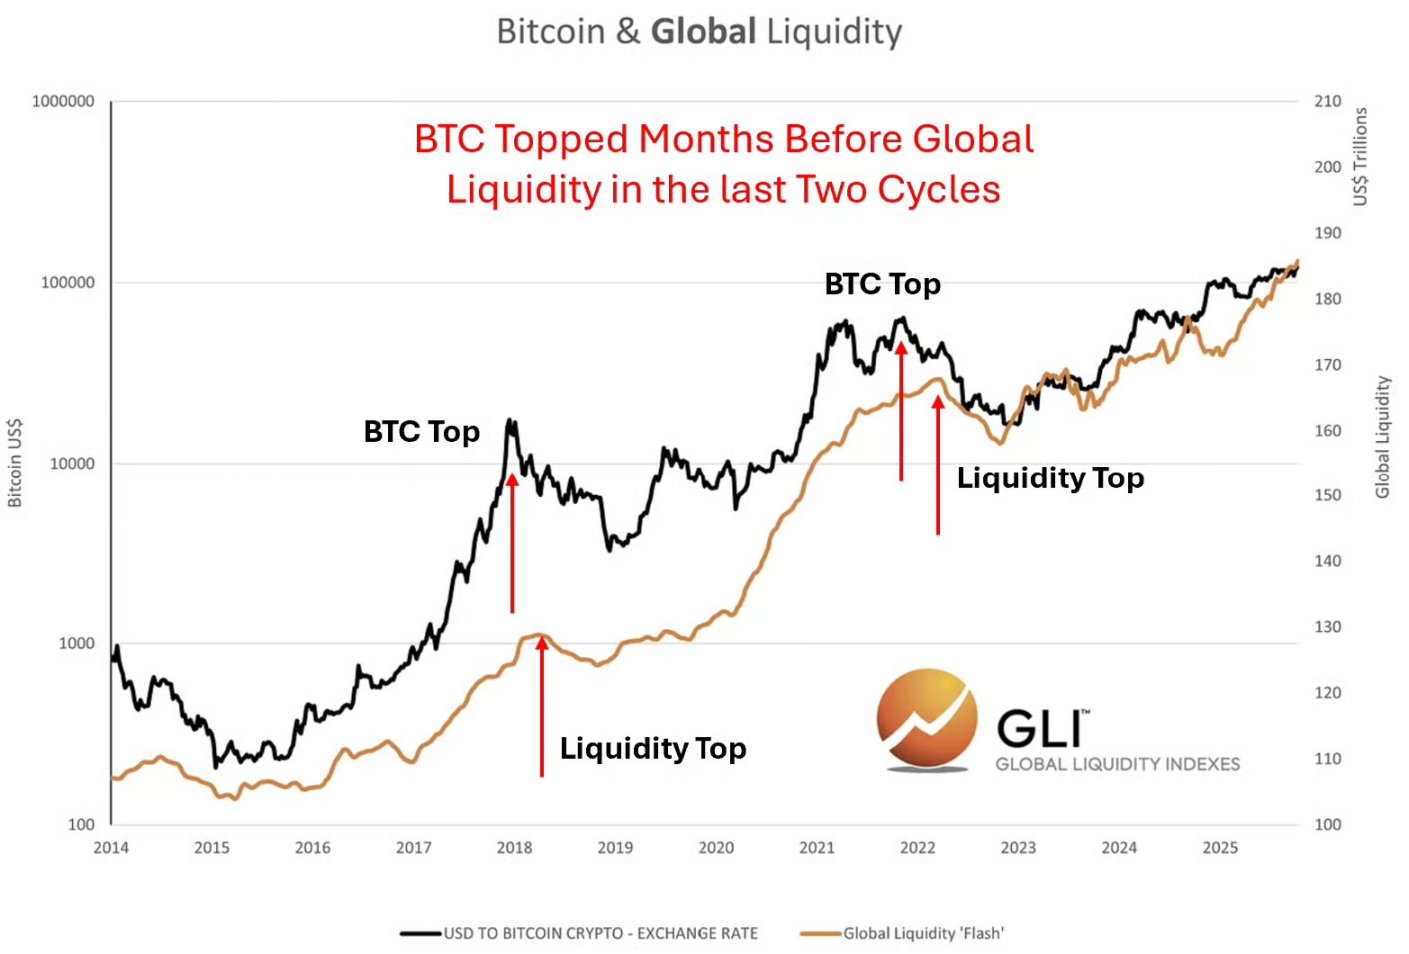
Source: Global Liquidity Indexes
This phenomenon contradicts the common claim that "Bitcoin prices lag behind liquidity."
Let's pause and consider a question: Why would Bitcoin lag behind liquidity conditions?
After all, markets are forward-looking; and Bitcoin trades 24/7 in global markets. For liquidity—a key price-related variable recognized by market participants—why would Bitcoin lag?
In fact, we believe that Bitcoin is leading global liquidity, especially at the top of market cycles.
Why? We think the market is preemptively reflecting the trend of tightening liquidity, sensing the changes ahead.
But at market bottoms (bear markets), the situation is the opposite: global liquidity often leads Bitcoin.
Why? Because in bear markets, the market usually waits for clear signals from monetary and fiscal authorities before acting.
It should be noted that we have not yet confirmed this view through quantitative analysis, but by analyzing the charts, we can support this judgment.
Assuming that global liquidity will expand again after Bitcoin peaks, then our core task is to identify the catalysts that cause global liquidity to decline.
In the last cycle, the catalyst was high inflation and the Federal Reserve being forced to raise rates quickly. This was the reason for the market's "pre-emptive move" in November 2021, when liquidity contraction was driven by central bank monetary policy.
So what could be the catalyst in this cycle?
In the current cycle, the pressure to tighten liquidity may not come from the Federal Reserve (the market expects the Fed to cut rates in October and December), but from fiscal policy.
Expected Fiscal Impact: Tariff Increases and BBB Spending Cuts
Expected Tariff Revenue: Assuming a tariff rate of 13%, it is expected to increase tariff revenue by $380 billions per year. The chart below shows the impact of tariffs so far.
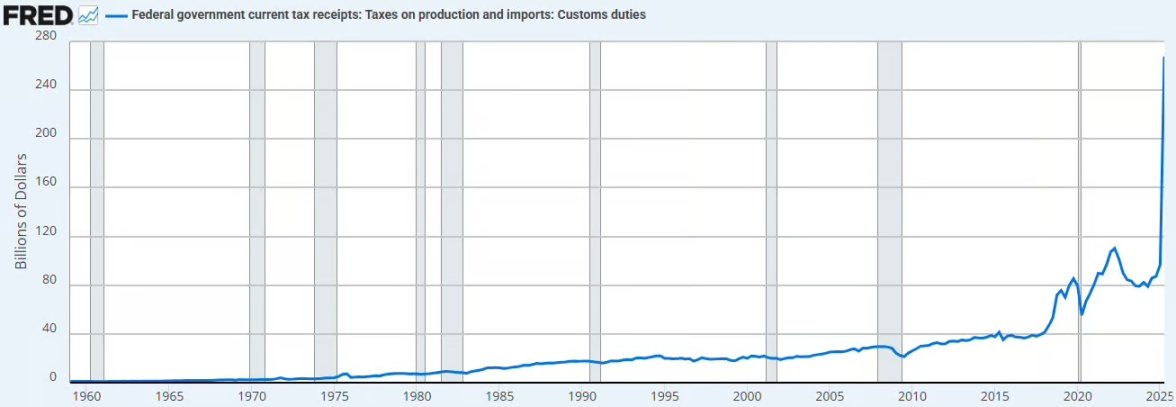
Source: Federal Reserve Economic Database
This will drain liquidity from the private sector and return it to the public sector's fiscal accounts.
We believe that even if this move does not trigger deflation, it will bring deflationary pressure.
Spending Cuts: The Congressional Budget Office (CBO) expects spending cuts of $1.2 trillions to $1.3 trillions over the next decade, including Medicaid reform, Supplemental Nutrition Assistance Program (SNAP) budget cuts, etc., equivalent to about $125 billions in spending cuts per year.
Adding tariff increases and spending cuts together, this will result in $505 billions of fiscal tightening per year, accounting for 1.7% of US GDP.
However, in 2026, the US will implement effective tax cuts for businesses, including tax exemption for tip income, and will add $35 billions in annual spending for infrastructure, defense, rural hospitals, NASA, and other areas.
These measures may offset the fiscal tightening brought by tariffs and spending cuts, but will the effect be enough?
If Bitcoin is indeed leading liquidity again at the cycle top, we believe it is currently "pre-emptively" reflecting the negative impact of fiscal policy tightening on liquidity.
You may often hear Bessent mention in interviews: "We hope to stimulate the economy through the private sector."
We agree with this direction, but the process of achieving this goal may be full of twists and turns. This is also why the Trump administration insists on substantial rate cuts—to bridge our transition to a new economic model.
Banking Sector Liquidity
In addition to the potential fiscal policy changes mentioned above, we also observe that banking sector liquidity is tightening.
The chart below shows the growing imbalance between liquidity among dealer banks and available collateral in the overnight funding period. This indicates that the money market is facing a liquidity shortage—dealers are either short of cash or short of collateral.
This phenomenon is consistent with the following factors:
- Fiscal tightening;
- Ongoing Fed balance sheet reduction;
- Rebuilding of the Treasury General Account balance.
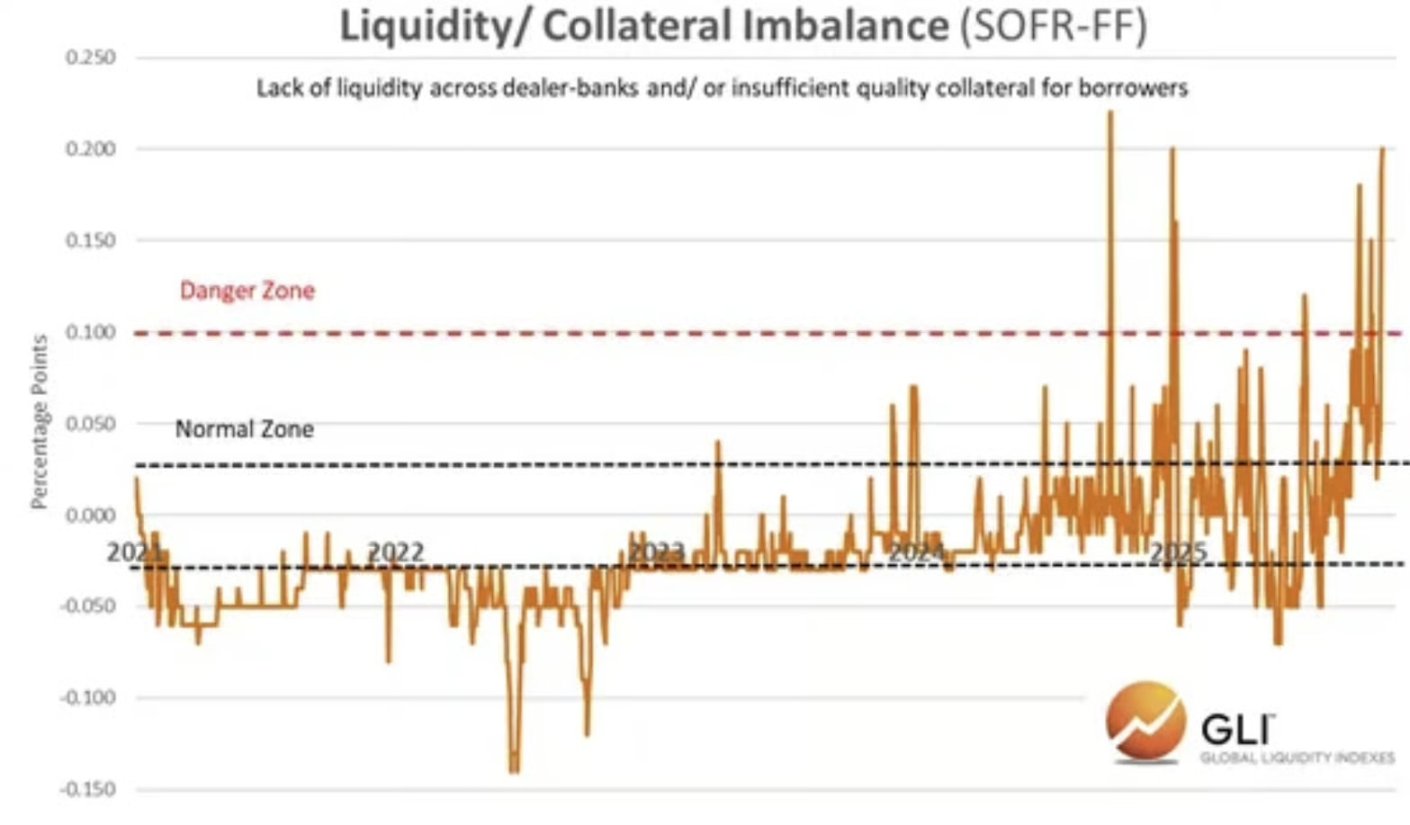
Source: Global Liquidity Indexes
As these factors ferment, bank reserves are approaching the shortage level set by the Federal Reserve.
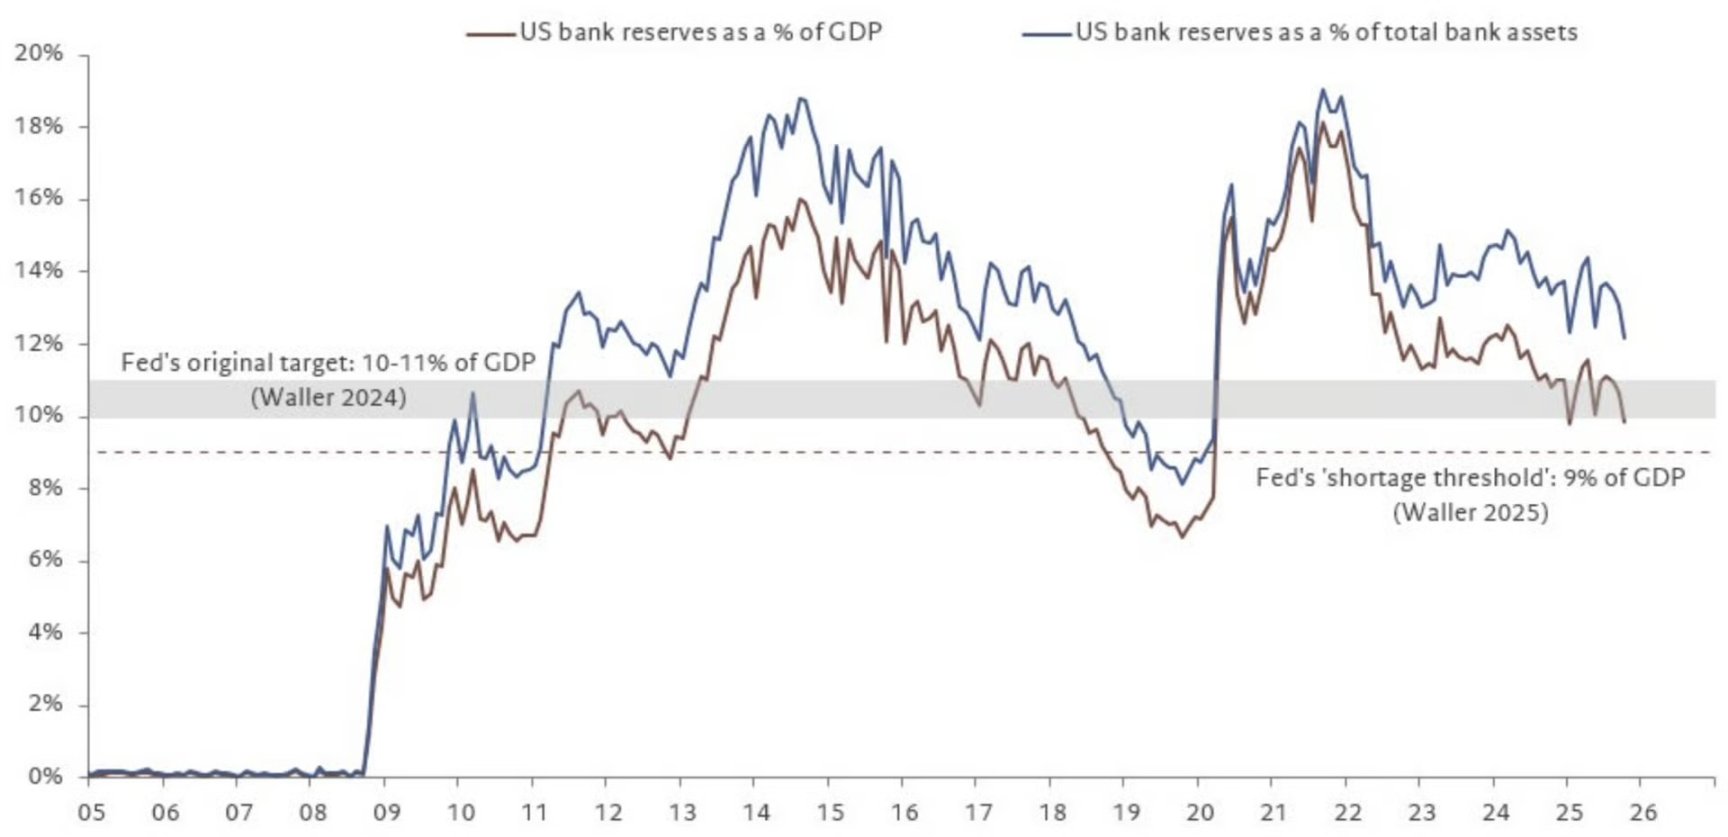
Source: @fwred
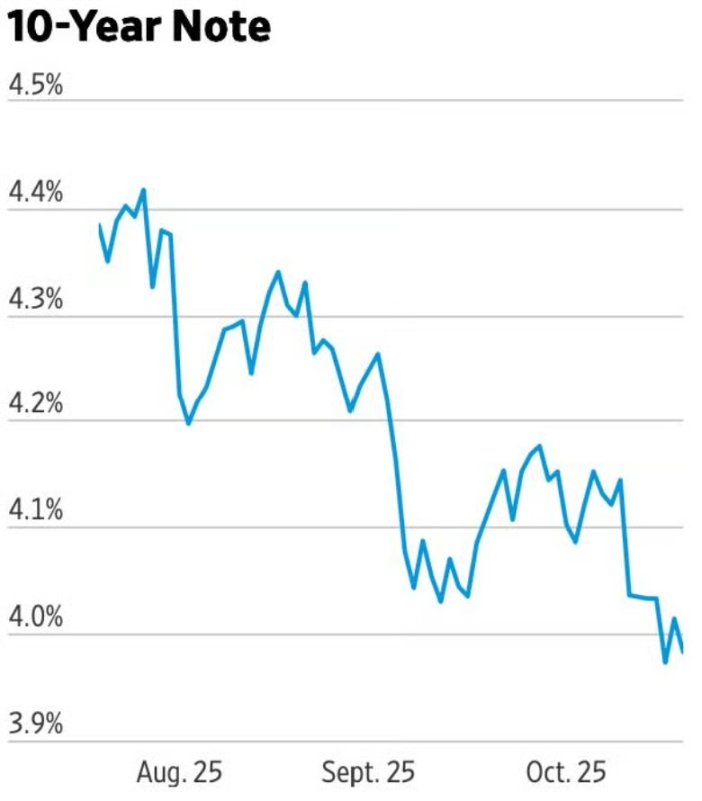
In summary, all signs indicate that trouble is brewing, and the performance of the bond market seems to confirm this.
Conclusion
It is clear that at the top of the previous two cycles, Bitcoin led global liquidity. In the 2021 cycle, Bitcoin preemptively sensed the trend of high inflation and rate hikes; at that time, the Biden administration was promoting a transition to a fiscal-dominated economic model, which was the core factor driving Bitcoin liquidity in this cycle.
So what about now?
We are gradually exiting the fiscal-dominated model. In our view, during this transition, risk assets may be negatively affected.
Disclaimer: The content of this article solely reflects the author's opinion and does not represent the platform in any capacity. This article is not intended to serve as a reference for making investment decisions.
You may also like
Aster DEX plans to allocate up to 80% of S3 fees for ASTER buybacks

Tether plans to expand USAT stablecoin reach to 100M Americans by December: CoinDesk

Peter Brandt Warns Bitcoin Trends Mirror 1970s Soybean Bubble
Bitcoin spikes to $112K on soft US CPI data as S&P 500 hits record high