Bitget App
Trade smarter
Buy cryptoMarketsTradeFuturesEarnWeb3SquareMore
Trade
Spot
Buy and sell crypto with ease
Margin
Amplify your capital and maximize fund efficiency
Onchain
Going Onchain, without going Onchain!
Convert & block trade
Convert crypto with one click and zero fees
Explore
Launchhub
Gain the edge early and start winning
Copy
Copy elite trader with one click
Bots
Simple, fast, and reliable AI trading bot
Trade
USDT-M Futures
Futures settled in USDT
USDC-M Futures
Futures settled in USDC
Coin-M Futures
Futures settled in cryptocurrencies
Explore
Futures guide
A beginner-to-advanced journey in futures trading
Futures promotions
Generous rewards await
Overview
A variety of products to grow your assets
Simple Earn
Deposit and withdraw anytime to earn flexible returns with zero risk
On-chain Earn
Earn profits daily without risking principal
Structured Earn
Robust financial innovation to navigate market swings
VIP and Wealth Management
Premium services for smart wealth management
Loans
Flexible borrowing with high fund security
Solana (SOL) To Rise Higher? Key Bullish Reversal Pattern Signaling Potential Upside Move

Solana (SOL) To Rise Higher? Key Bullish Reversal Pattern Signaling Potential Upside Move

CoinsProbeCoinsProbe2025/10/15 13:51
By:Nilesh Hembade

Date: Wed, Oct 15, 2025 | 09:30 AM GMT

The cryptocurrency market is staging a notable rebound today, led by Ethereum (ETH) , which has surged over 4%, jumping to $4,180 from its 24-hour low of $3,895. Riding this wave, Solana (SOL) is also showing signs of strength — and its chart hints at something even more interesting.

Over the past 24 hours, SOL has climbed around 5%, and its technical setup is now signaling the potential for a much larger upside move ahead.

Solana (SOL) To Rise Higher? Key Bullish Reversal Pattern Signaling Potential Upside Move image 0 Source: Coinmarketcap

Bump-and-Run Reversal (BARR) Pattern

On the 1-hour chart, Solana’s price structure is forming a Bump-and-Run Reversal (BARR) pattern — a well-known technical formation that often marks the transition from a downtrend to a fresh bullish phase.

The Lead-in Phase began when SOL was rejected near the descending resistance line around $224, followed by a steep decline that found a bottom at $144, completing the Bump Phase.

Solana (SOL) To Rise Higher? Key Bullish Reversal Pattern Signaling Potential Upside Move image 1 
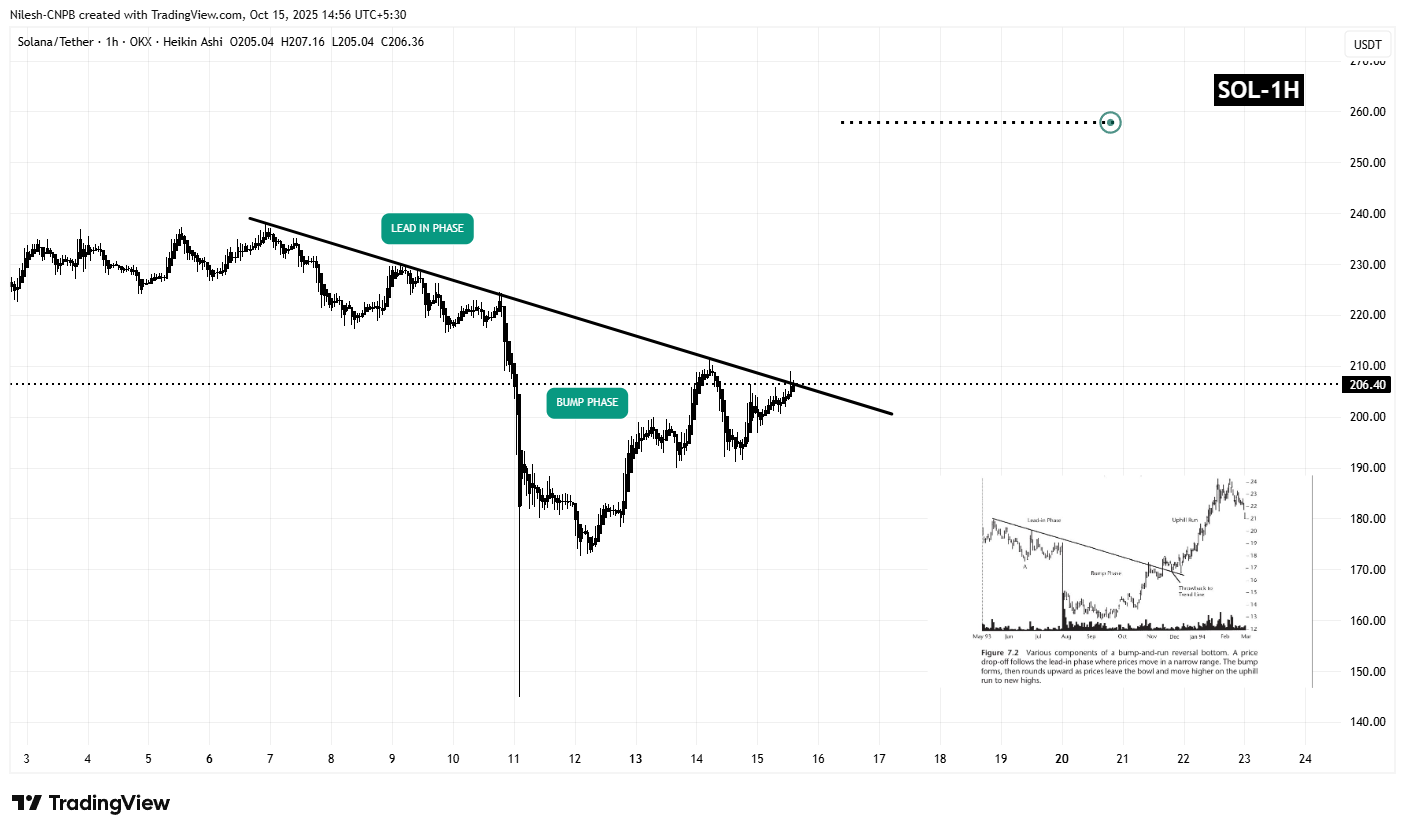
Solana (SOL) 1H Chart/Coinsprobe (Source: Tradingview)

From that low, SOL rebounded strongly, reclaiming lost ground and currently trading near $206, where it is now testing the downtrend resistance line — a critical moment for confirming a potential breakout.

What’s Next for SOL?

If SOL manages to break above and successfully retest the descending trendline, it would confirm the start of the Uphill Run Phase — typically the most powerful stage of the BARR pattern, characterized by accelerating bullish momentum.

Based on technical projections, a confirmed breakout could push SOL toward the $258 zone, representing an estimated 25% potential gain from current levels if momentum sustains.

However, traders should remain cautious and watch for a clean breakout and retest confirmation before entering larger positions, as rejection from the trendline could delay the rally in the short term.

0

Disclaimer: The content of this article solely reflects the author's opinion and does not represent the platform in any capacity. This article is not intended to serve as a reference for making investment decisions.

PoolX: Earn new token airdrops
Lock your assets and earn 10%+ APR
Lock now!

You may also like

Powell sees signs of crisis

Powell's primary motivation for halting quantitative tightening is to prevent a liquidity crisis in the financial markets.

ForesightNews2025/10/15 14:42
Powell sees signs of crisis