This year has been exceptional for both Wall Street and investors. The leading S&P 500 ( ^GSPC 0.01%), the well-known Dow Jones Industrial Average ( ^DJI 0.51%), and the tech-driven Nasdaq Composite ( ^IXIC -0.28%) have all reached multiple new all-time closing records.
However, the situation was quite different half a year ago. Not long after President Donald Trump introduced his tariff and trade strategies, the market experienced a sharp downturn, causing the S&P 500 to suffer its fifth-largest two-day percentage drop since 1950.
Following the bottom of this brief crash on April 8, the Dow Jones, S&P 500, and Nasdaq Composite surged by 24%, 35%, and 50%, respectively, by the close on Oct. 2. This short-lived panic gave investors a chance to capitalize on outstanding businesses at lower prices. This kind of patient, opportunistic approach is exactly what has made Berkshire Hathaway's ( BRK.A 0.70%) ( BRK.B 0.68%) soon-to-retire billionaire CEO Warren Buffett so successful over the past sixty years.

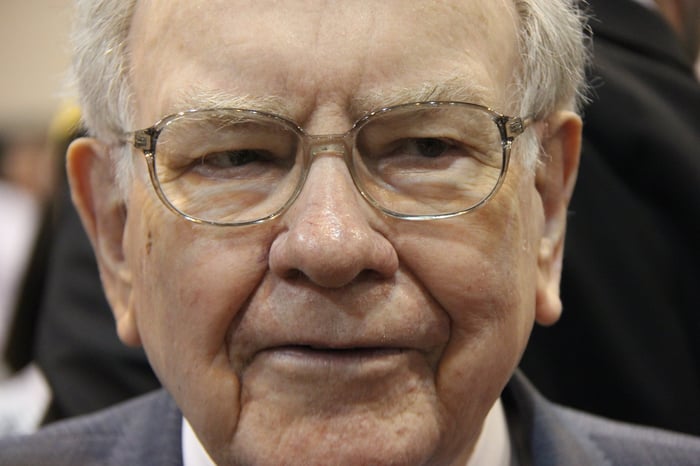
Berkshire Hathaway CEO Warren Buffett. Image source: The Motley Fool.
Yet, above all, Buffett’s achievements are rooted in his unwavering commitment to value. While the Oracle of Omaha has occasionally strayed from some of his informal investing guidelines, he has always maintained strict standards regarding stock valuations. Simply put, if the price doesn’t add up, he won’t invest.
Just last week, Buffett’s favored stock valuation metric reached unprecedented levels.
The Warren Buffett indicator reaches an all-time peak
When most people assess a stock or the market’s overall value, they typically use the well-established price-to-earnings (P/E) ratio, which compares a company’s share price to its earnings over the past year. This metric is useful for established firms but can be less reliable during economic downturns or for rapidly growing companies.
For the billionaire at Berkshire, no valuation tool is more comprehensive than the market-cap-to-GDP ratio. Buffett described this as “probably the best single measure of where valuations stand at any given moment” in a 2001 Fortune magazine interview.
This ratio totals the market value of all publicly listed companies and divides it by the U.S. gross domestic product (GDP). It’s now widely known as the Warren Buffett indicator.
Warren Buffett indicator hits 220% for the first time in history 🚨🚨 The Stock Market topped at 190% during the Dot Com Bubble 🤯👀 pic.twitter.com/sGE9fAcHtR
-- Barchart (@Barchart) September 20, 2025
Looking back to 1970, the Buffett indicator has averaged around 85%. This means that, over the past 55 years, the combined value of all U.S. stocks has typically been about 85% of the nation’s GDP.
On September 30, the indicator closed at 219.99% and briefly surpassed 220% during the trading day. This marks a new record for this metric and is an astonishing 159% above its long-term average.
The current Wall Street environment, fueled by the artificial intelligence (AI) boom, is a clear example of investor exuberance. People are betting on explosive AI-driven growth, anticipating more rate cuts from the Federal Reserve, and hoping for resolution on tariffs from President Trump. However, such lofty valuations have never been sustainable in the past.
Whenever the Buffett indicator has previously soared well above its prior highs, it has eventually (the key word!) been followed by significant market declines. While the market-cap-to-GDP ratio isn’t a tool for timing the market and can’t predict exactly when the S&P 500, Dow Jones, or Nasdaq might fall, it has served as a warning sign before the dot-com crash, the Great Recession, and the 2022 bear market.
There’s no doubt that now is the moment to be cautious when others are overly optimistic.

Image source: Getty Images.
Buffett may not be buying stocks overall, but he remains confident in America’s future
The historically high reading of the Buffett indicator, along with other valuation metrics, has likely contributed to Warren Buffett’s ongoing selling streak over the past 11 quarters (Oct. 1, 2022 – June 30, 2025). During this period, Berkshire has sold more shares than it has bought, totaling $177.4 billion in net sales.
Yet, one thing the Oracle of Omaha never does is lose sight of the long-term. No matter how bleak the economic signals or valuation levels may appear, Berkshire Hathaway’s billionaire leader knows that both the U.S. economy and Wall Street are shaped by unpredictable cycles of expansion and contraction.
Buffett and his top executives recognize that slowdowns and recessions are a normal part of the American economic landscape over the decades. No amount of monetary policy can completely prevent occasional downturns.
At the same time, Buffett understands that economic contractions are usually brief. Since the end of World War II, all 12 U.S. recessions have lasted between two and 18 months. In contrast, there have been two economic expansions that each lasted over a decade. The U.S. economy spends much more time growing than shrinking, which is why, even if Buffett isn’t buying much due to high valuations, he refuses to bet against America.
The same logic applies to the stock market.
Patience and a long-term view are the most valuable tools for investors. ^SPX data from YCharts. S&P 500 performance from Jan. 3, 1950 to Oct. 2, 2025.
According to data shared on X by Bespoke Investment Group in June 2023, the average S&P 500 bear market since the Great Depression began in September 1929 has lasted only 286 days, or about 9.5 months. Out of 27 bear markets in nearly 94 years, just eight have continued for at least a year.
By comparison, the average S&P 500 bull market has lasted 1,011 days, or roughly 3.5 times longer than the typical bear market.
Buffett and his team are likely just waiting for market mispricings to appear before making their move. While it may take some time for valuations to become attractive again, maintaining a long-term optimistic outlook has consistently worked in favor of Warren Buffett—and investors in general—on Wall Street.