

Litecoin price prediction: Litecoin is showing technical breakout signals and strong support near $94, suggesting a potential 200% rally toward $354.36 if momentum and volume confirm historical cycle patterns over the coming months.
-
Consolidation near $94 with support at $60–$120 and historical bottoms at $23–$45.
-
MACD crossovers, breakout patterns and rising volume are cited as buy-signals by market analysts.
-
Historical cycle analysis shows less volatility and more sustained accumulation, supporting a possible 200% move to $354.36.
Litecoin price prediction: LTC breakout signals point to a 200% rally to $354.36—track volume and MACD now to act. Read more for key levels and steps.
What is the Litecoin price prediction and why does it matter?
Litecoin price prediction forecasts a potential 200% rally toward $354.36 based on technical indicators, historic cycle patterns, and current consolidation near $94. Traders monitor MACD, breakout formations and volume spikes to validate momentum before positioning for a multi-month rally.
How do technical indicators support a potential Litecoin breakout?
Technical indicators point to a breakout setup. MACD crossovers and bullish momentum divergences resemble pre-2021 rally conditions. Descending resistance trendlines remain the key obstacle; a daily close above these lines with expanding volume would strengthen the breakout case.
Why do historical cycles support a Litecoin rally?
Litecoin’s history shows distinct cycles: a deep accumulation from 2018 lows near $23, the 2021 run to roughly $410, and a multi-year correction into 2022. These cycles now display reduced volatility and longer accumulation phases, which can enable sustained rallies when momentum returns.
TradingView chart analysis covering 2018–2025 highlights these multi-year swings and provides context for current price structure. Source: Javon Marks (chart analysis on TradingView) — cited as plain text for context and attribution.
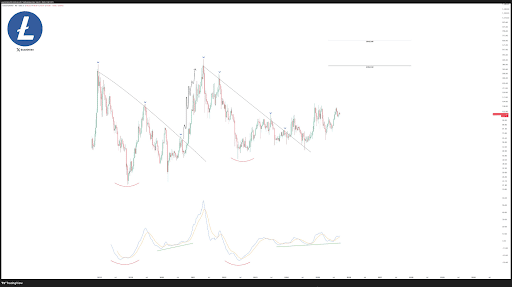
Source: Javon Marks
When should traders consider positioning for Litecoin?
Traders should consider entering when Litecoin posts a decisive daily close above the descending resistance trendline accompanied by above-average volume and confirming MACD momentum. Until then, risk management around support zones is essential.
What risk management steps are recommended?
Use tight position sizing and place stop-loss orders below defined support zones (e.g., below $60 or the $40–$45 basin for larger exposure). Scale into positions and plan partial exits near measured targets such as the $354.36 projection.
Frequently Asked Questions
How likely is a 200% rally for Litecoin in the next cycle?
Analysts cite pattern similarity and indicator alignment as plausible reasons for a 200% rally, but probability depends on confirmed daily breakouts, rising volume and macro market conditions. Always combine technical signals with risk controls.
What time frame should traders use to validate the breakout?
Daily and weekly timeframes provide reliable validation. A confirmed daily close above resistance with weekly follow-through and volume offers stronger conviction than intraday moves.
Key Takeaways
- Technical setup: MACD, breakout formations and volume increases are the primary bullish signals to watch.
- Support and risk: Key support bands at $23–$25, $40–$45, and current consolidation between $60–$120 define stop zones.
- Actionable step: Wait for confirmed daily breakout with volume, then scale positions with defined stops and targets.
Conclusion
Litecoin price prediction centers on a potential 200% rally to $354.36 if current consolidation near $94 resolves into a confirmed breakout with MACD support and rising volume. Monitor trendline breaks and volume for trade confirmation, apply risk management and follow updates from recognized analysts such as Javon Marks and platform data on TradingView.
Published: 2025-09-21 | Updated: 2025-09-21 | Author: COINOTAG