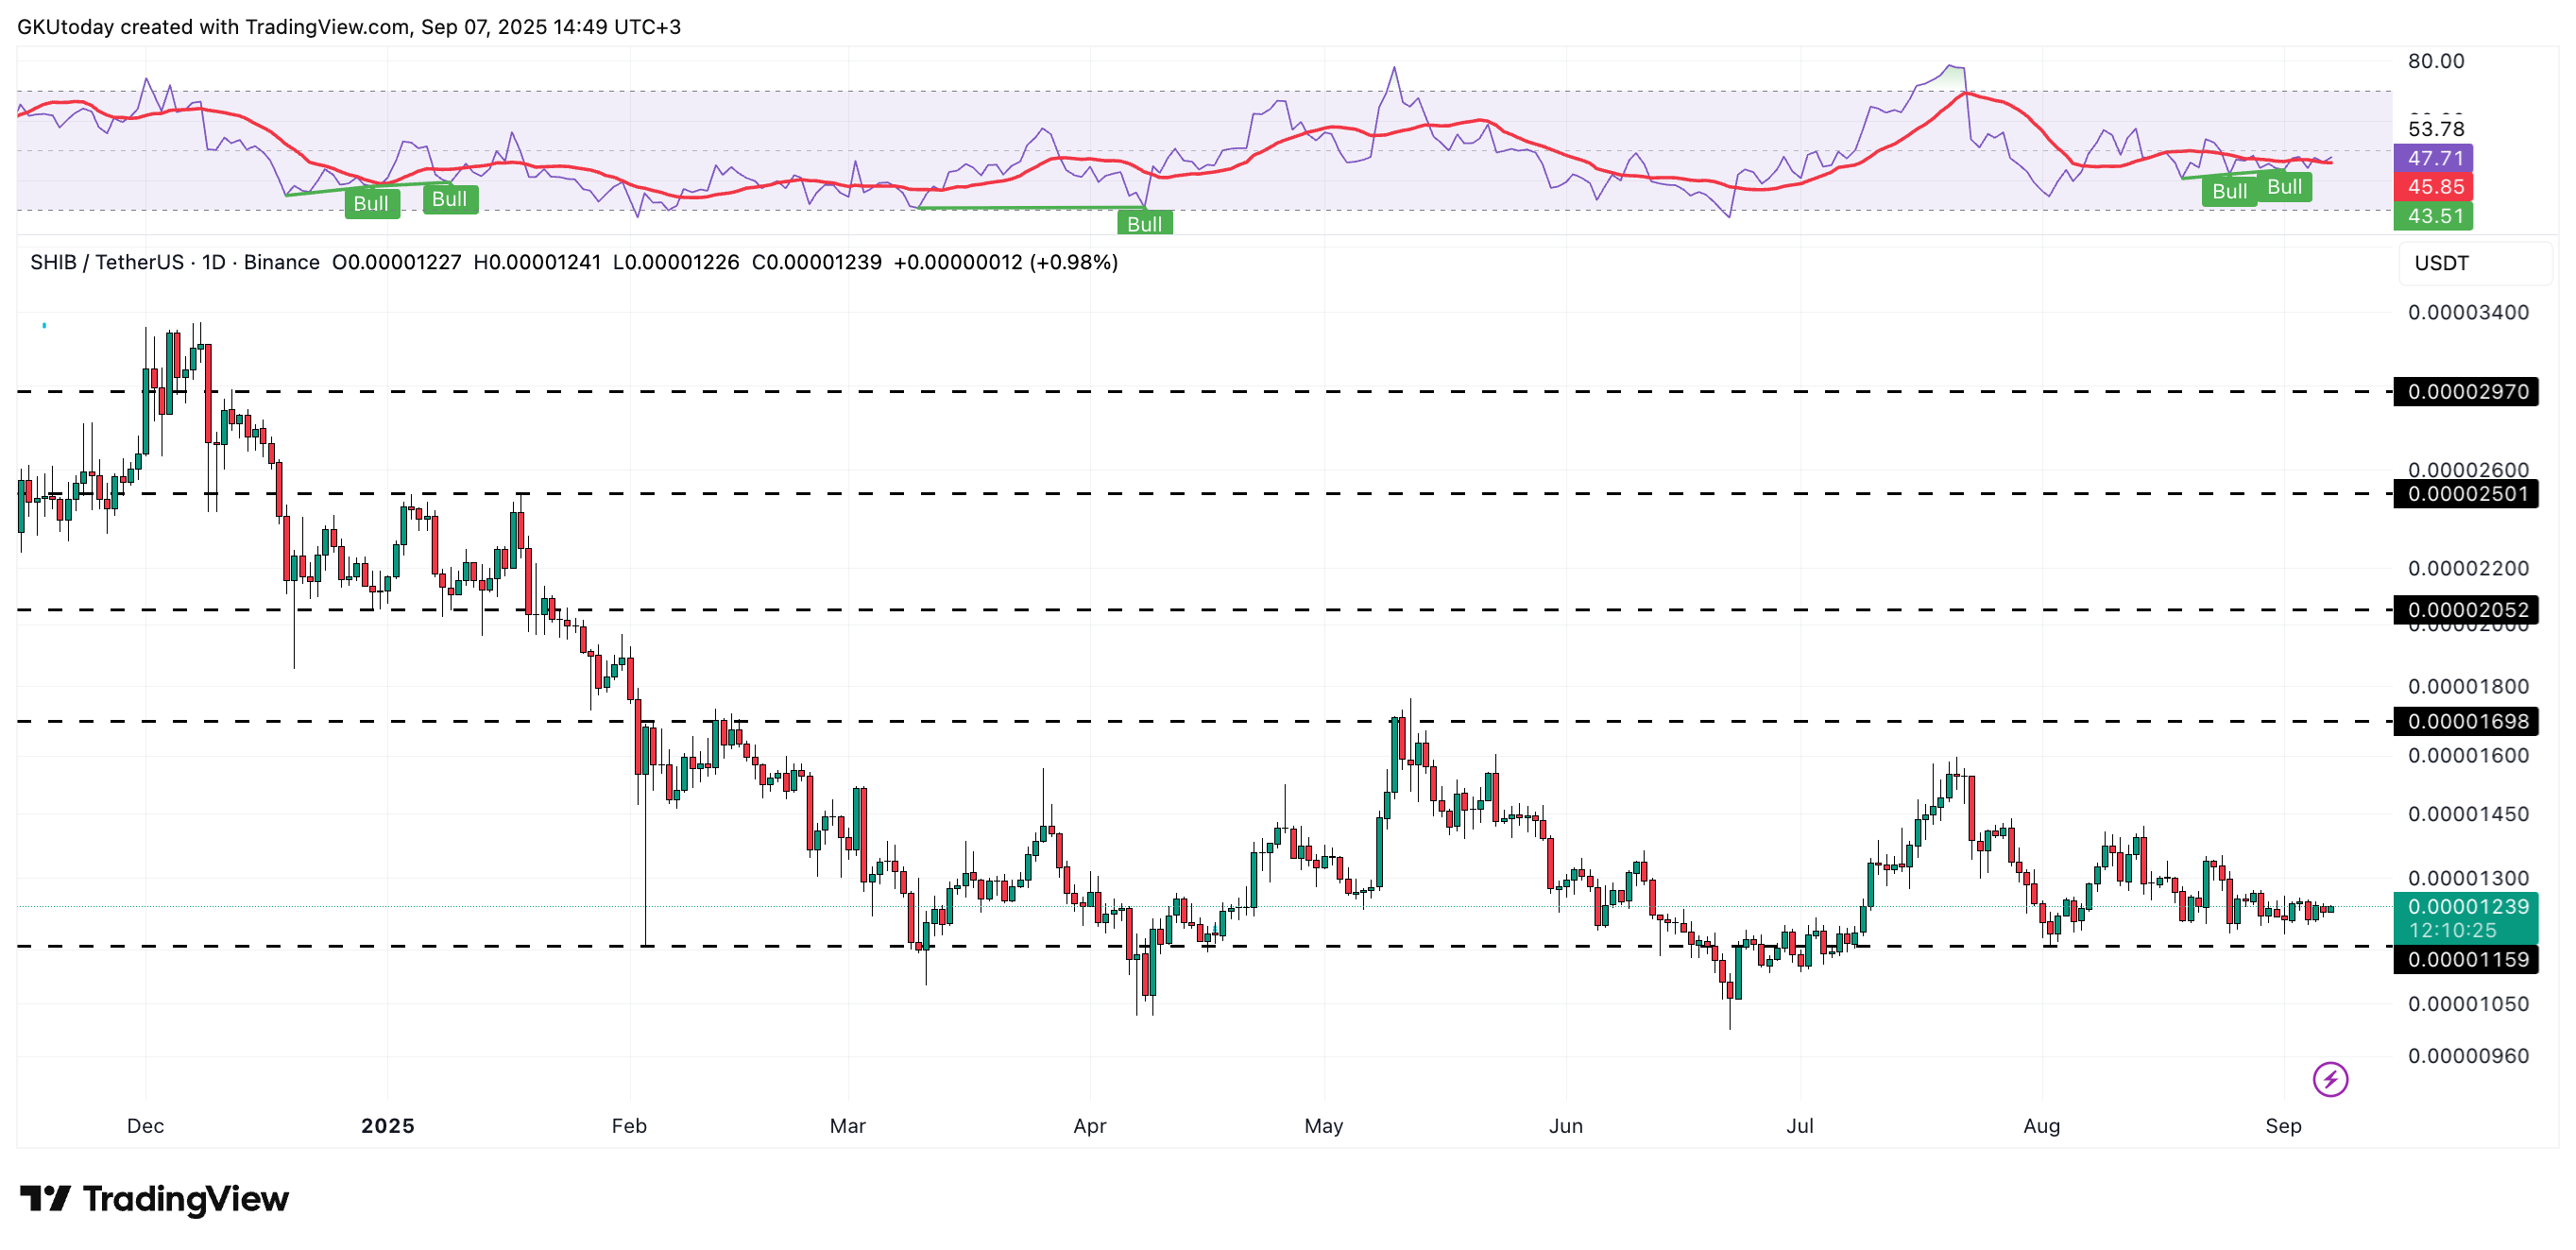
SHIB price is holding a critical support at $0.00001159 and showing bullish RSI divergence, suggesting a high-probability setup for a rapid upside move if buyers sustain volume. Short-term resistance sits at $0.00001698 and $0.00002052 — clears these and momentum could spike sharply.
-
Support: $0.00001159 — repeatedly defended
-
Bullish RSI divergence with tightening daily range — signals buyer accumulation
-
Key resistances: $0.00001698, $0.00002052; volume profile confirms low sell-side participation
SHIB price outlook: Shiba Inu holding $0.00001159 support; watch $0.00001698 and $0.00002052 for breakout. Read on for scenario analysis and trade-grade levels.
What is the current Shiba Inu (SHIB) price setup?
Shiba Inu price is currently anchored at a key support cushion of $0.00001159, where repeated absorptions of dips indicate strong buyer interest. On the daily chart volatility has contracted and RSI is showing bullish divergence, a classic precursor to a forceful upside candle if volume returns.
How has SHIB price behaved around $0.00001159?
Price has tested this floor multiple times through the summer and each decline was absorbed quickly. Candles have grown smaller and the range has tightened, indicating lower volatility. This consolidation near a defended base often precedes a directional breakout.
Source: TradingView
How likely is a breakout and what are the target levels?
Short-term momentum favors a breakout if buyers step in with volume. The first upside test is at $0.00001698, followed by $0.00002052 — the latter marks the edge of the last failed rally. Clearing those opens targets at $0.00002501 and $0.00002970 based on prior rebound phases.
Conversely, a decisive break below $0.00001159 on heavy volume would invalidate the bullish case and risk a deeper sell-off. Current volume profile shows thinning sell-side participation, reducing immediate downside odds.
What technical signals support a bullish scenario?
1) Daily RSI bullish divergence: indicator lifting while price drifts sideways or lower. 2) Shrinking candle bodies and tightening range: volatility compression. 3) Declining trade volume on push attempts: lower selling pressure. These combined point to buyer accumulation at the base.
Shiba Inu (SHIB) price scenarios
On the upside, sequential resistance levels to monitor are:
- $0.00001698: first significant barrier
- $0.00002052: edge of the last failed rally
- $0.00002501 — $0.00002970: higher targets if momentum sustains
On the downside, the critical invalidation point remains $0.00001159. A low-volume consolidation near this support favors buyers; high-volume breakdown favors sellers.
Frequently Asked Questions
Is the SHIB price likely to form a “God candle” from this support?
SHIB can produce a large bullish “God candle” if bullish RSI divergence converts into strong buy volume. The setup is favorable, but a breakout requires clear volume confirmation above $0.00001698 to validate an explosive move.
What risk management levels should traders use for SHIB?
Traders should use tight stops below $0.00001159 for long entries and scale targets at $0.00001698 and $0.00002052. Position sizing must account for high volatility typical of meme coins.
Key Takeaways
- Defended support: $0.00001159 — multiple absorptions show buyer interest
- Momentum trigger: RSI bullish divergence with range contraction — watch for volume confirmation
- Actionable levels: Targets at $0.00001698, $0.00002052, $0.00002501; invalidation below $0.00001159
Conclusion
Shiba Inu (SHIB) is holding a crucial base at $0.00001159 and displaying technical signs that favor an upside breakout if buyers return with volume. Monitor $0.00001698 and $0.00002052 for confirmation, and manage risk with disciplined stops below the defended support. COINOTAG will update this piece as new on-chain and market data emerge.
![[Bitpush Daily News Highlights] Texas Lieutenant Governor officially announces the purchase of bitcoin, aiming to build America’s digital future hub; Economists expect the Federal Reserve to cut interest rates in December, with two more possible cuts in 2026; Circle has issued an additional 10 billions USDC in the past month; Sources: SpaceX is in talks over share sales, with valuation possibly soaring to 800 billions USD.](https://img.bgstatic.com/multiLang/image/social/dd58c36fde28f27d3832e67b2a00dab41764952203123.png)