Shiba Inu price is showing a short-term bearish signal as the 50-day EMA crossed below the 100-day EMA, forming a mini death cross. This, combined with a 40% drop in exchange inflows and low volumes, suggests higher volatility and downside risk unless buyers defend $0.00001200.
-
Mini death cross formed: 50-day EMA below 100-day EMA on daily chart.
-
Exchange inflows dropped ~40%, indicating thinner liquidity and less speculative interest.
-
Key levels: support $0.00001200 and $0.00001150; resistance $0.00001297 (100 EMA) and $0.00001388 (200 EMA).
Shiba Inu price alert: 50/100 EMA mini death cross, falling inflows, and low volume raise short-term risk — monitor support at $0.00001200. Read trade guidance.
What is causing the recent Shiba Inu price weakness?
Shiba Inu price weakness stems from a technical mini death cross—where the 50-day EMA moved below the 100-day EMA—paired with a roughly 40% decline in exchange inflows and subdued trading volumes. These factors point to waning bullish momentum and higher sensitivity to downside moves.
How is the 50/100 EMA mini death cross interpreted?
The 50/100 EMA crossover is read as a short-term trend shift rather than a long-term reversal. Analysts treat this mini death cross as an early warning sign of weakening momentum, especially when confirmed by lower volumes and falling exchange inflows. Official charting data source: TradingView (mentioned as plain text).
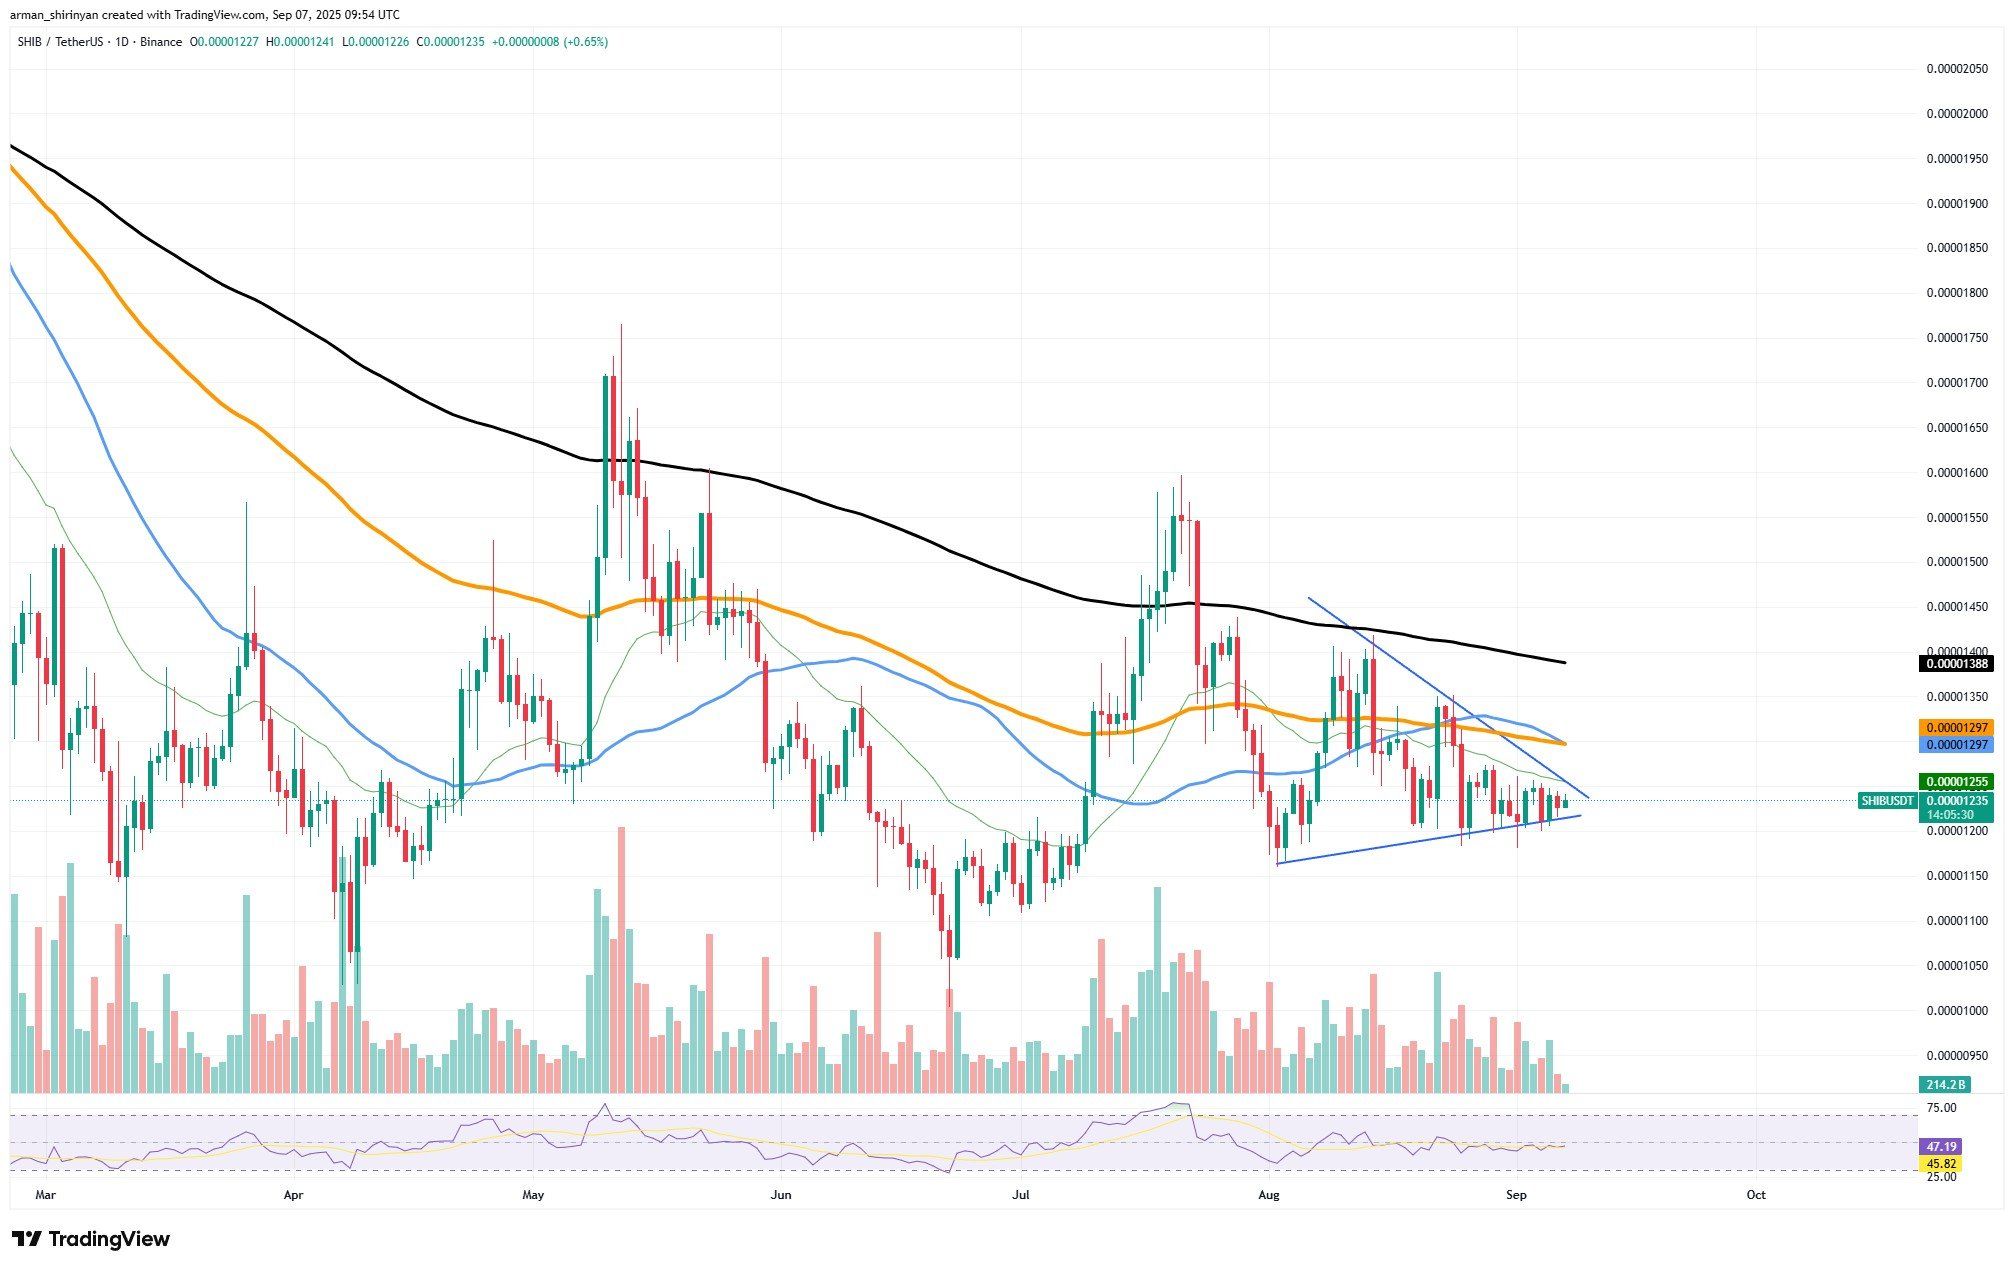
SHIB/USDT Chart by TradingView
Technical structure shows price compressing within a tightening wedge while hovering near $0.00001236. A breakdown below immediate support at $0.00001200 could accelerate losses toward stronger downside cushion at $0.00001150.
The path back to bullish conviction requires clearing resistance at $0.00001297 (near the 100-day EMA). Regaining $0.00001388 (200-day EMA) would overturn the short-term bearish signal and restore broader trend momentum.
Why do falling exchange inflows matter for SHIB?
Exchange inflows fell about 40%, indicating reduced selling pressure in the short term but also thinner liquidity. Lower inflows often reflect declining speculative interest, which can magnify price swings when orders hit the market. On-chain and exchange flow data were referenced for context as plain text (on-chain analytics and exchange reports).
What do momentum indicators show?
RSI is trading near 47, consistent with indecision. The weak volumes compared with July highs imply neither bulls nor bears control price. Traders should watch changes in volume as a confirmation signal for any breakout or breakdown.
Frequently Asked Questions
How should traders manage risk around SHIB now?
Traders should reduce position size, set tight stop-loss levels below $0.00001200, and require volume confirmation for any long entries. Prioritize capital preservation while monitoring inflows and RSI for shifts in momentum.
Key Takeaways
- Mini death cross: 50-day EMA crossing below the 100-day EMA signals short-term bearish risk.
- Liquidity drop: ~40% decline in exchange inflows reduces speculative interest and increases volatility risk.
- Actionable levels: Defend $0.00001200; breakdown risks $0.00001150; resistance sits at $0.00001297 and $0.00001388.
Conclusion
The Shiba Inu price outlook is cautiously negative in the short term due to a 50/100 EMA mini death cross, falling exchange inflows, and muted volume. Traders should prioritize risk management, monitor liquidity and RSI, and look for volume-confirmed moves above $0.00001297 or decisive support holds at $0.00001200 before shifting bias. COINOTAG will continue to track on-chain and exchange metrics and update guidance as conditions evolve.