Date: Wed, Sept 03, 2025 | 09:58 AM GMT
The cryptocurrency market remains mixed as Bitcoin (BTC) consolidates near $111,000, while Ethereum (ETH) hovers around $4,350 after retreating from its recent high of $4,953 with a 5% weekly drop. Despite this broader choppiness, several altcoins are showing early signs of strength—including Cosmos (ATOM).
ATOM is trading back in the green today, and more importantly, its chart is now displaying a key pattern formation that hints at a potential breakout in the sessions ahead.
 Source: Coinmarketcap
Symmetrical Triangle in Play?
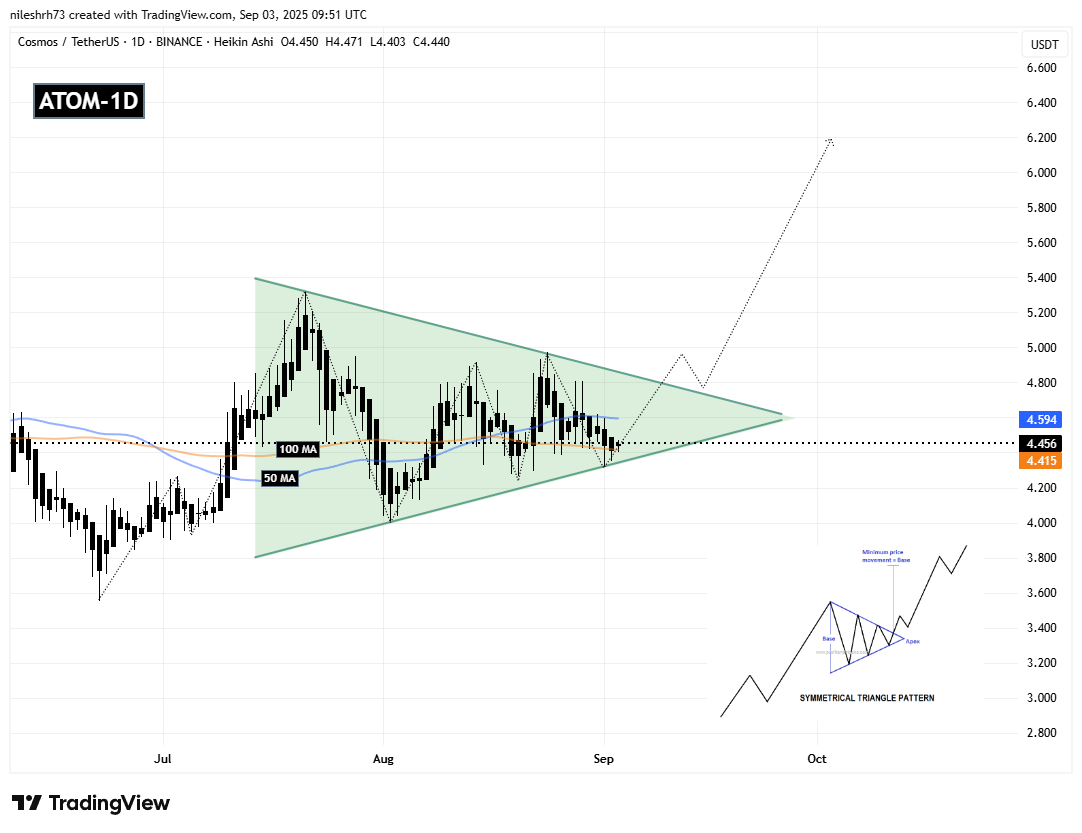
On the daily chart, ATOM is shaping a Symmetrical Triangle pattern, a structure often viewed as a continuation setup, though it can break in either direction depending on momentum.
The recent rejection from the resistance trendline near $4.97 pulled the price back toward its support base around $4.32. Buyers stepped in strongly, defending that level and sparking a rebound. This move helped ATOM reclaim its 100-day moving average ($4.41), with the token now trading near $4.45, signaling early resilience.
 Cosmos (ATOM) Daily Chart/Coinsprobe (Source: Tradingview)
A key test is underway as ATOM approaches its 50-day moving average ($4.59). A decisive breakout and close above this level could flip it into strong support, reinforcing bullish sentiment and increasing the chances of an upside breakout.
What’s Next for ATOM?
If ATOM manages to reclaim the 50-day MA and sustain momentum, the next test will be the resistance trendline near $4.80. A clean breakout above this barrier—ideally backed by strong trading volume—could confirm bullish continuation and trigger a rally toward the technical target of $6.09, based on the triangle’s measured move projection.


