ETH price is trading at $4,394 and is testing local support near $4,360 after a 1.34% intraday decline. Falling volume points to limited momentum; a daily close below $4,360 raises the probability of a test of $4,300, while a decisive breakout above $5,000 would revive bullish bias.
-
ETH price at $4,394; short-term support sits near $4,360.
-
Volume is decreasing, suggesting sideways trading is the most likely near-term outcome.
-
Intraday change: −1.34%; key levels: $4,360 support, $4,300 downside target, $5,000 pivotal resistance.
ETH price at $4,394; short-term support near $4,360 is under pressure. Read concise technical analysis, volume signals, and steps traders can use today.
What is the current ETH price outlook?
ETH price is trading at $4,394 and shows short-term weakness, with the market testing local support around $4,360. Falling volume indicates limited conviction from both buyers and sellers, making sideways trading the most probable near-term scenario unless one side breaks the key $5,000 or $4,300 levels.
The market opened the month with a bearish tilt, according to CoinStats, and intraday data from TradingView charts confirm the recent pullback. Traders should watch daily closes around support levels to gauge the next directional move.
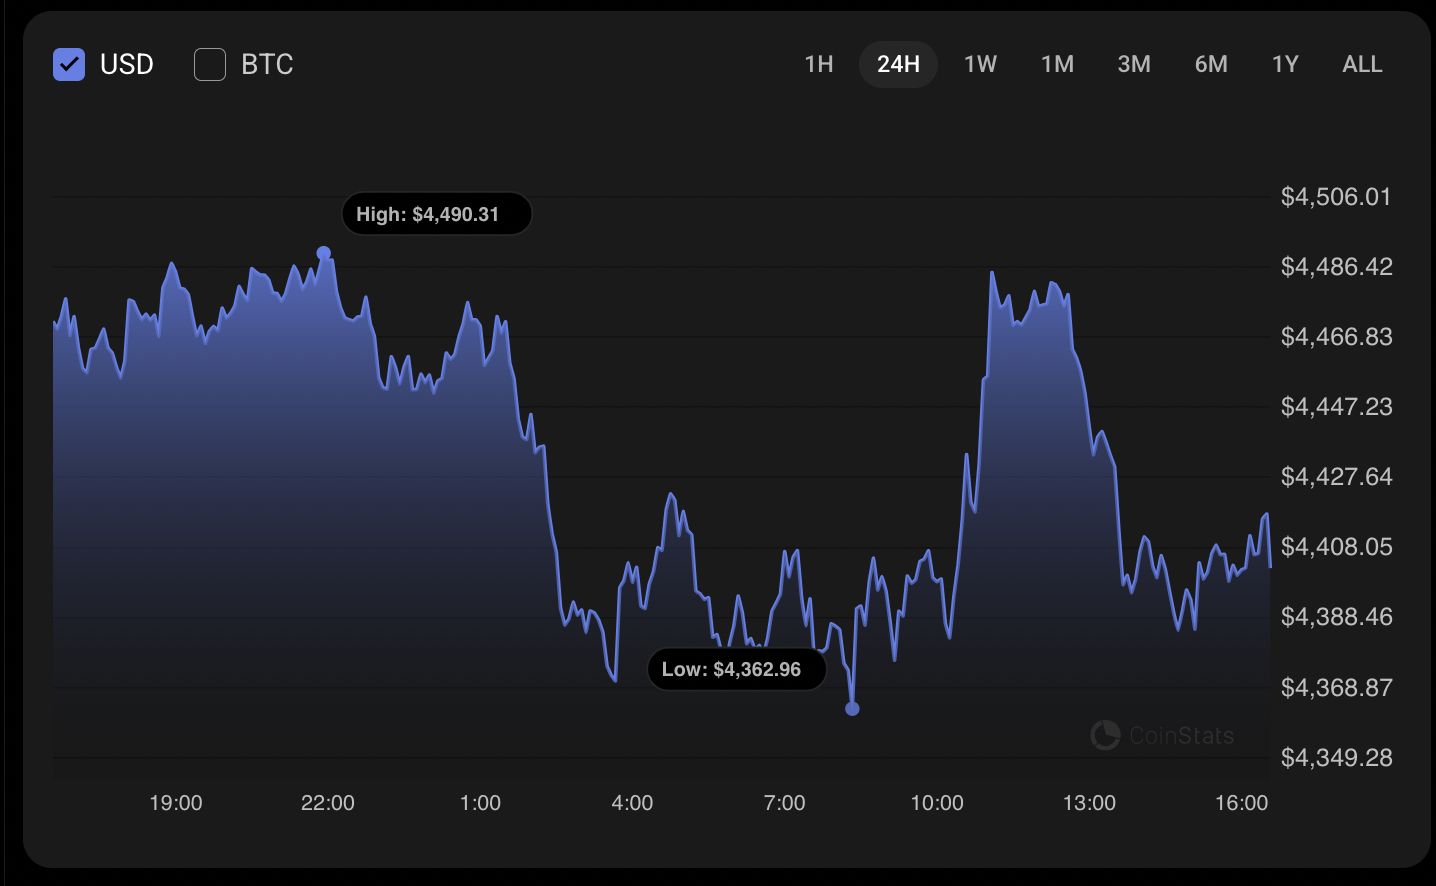
ETH chart by CoinStats
ETH/USD technical snapshot
The rate of Ethereum (ETH) dropped by 1.34% since yesterday and is currently testing local support near $4,360. Short-term indicators favor caution: momentum is waning and volume is contracting, which historically precedes consolidation phases.
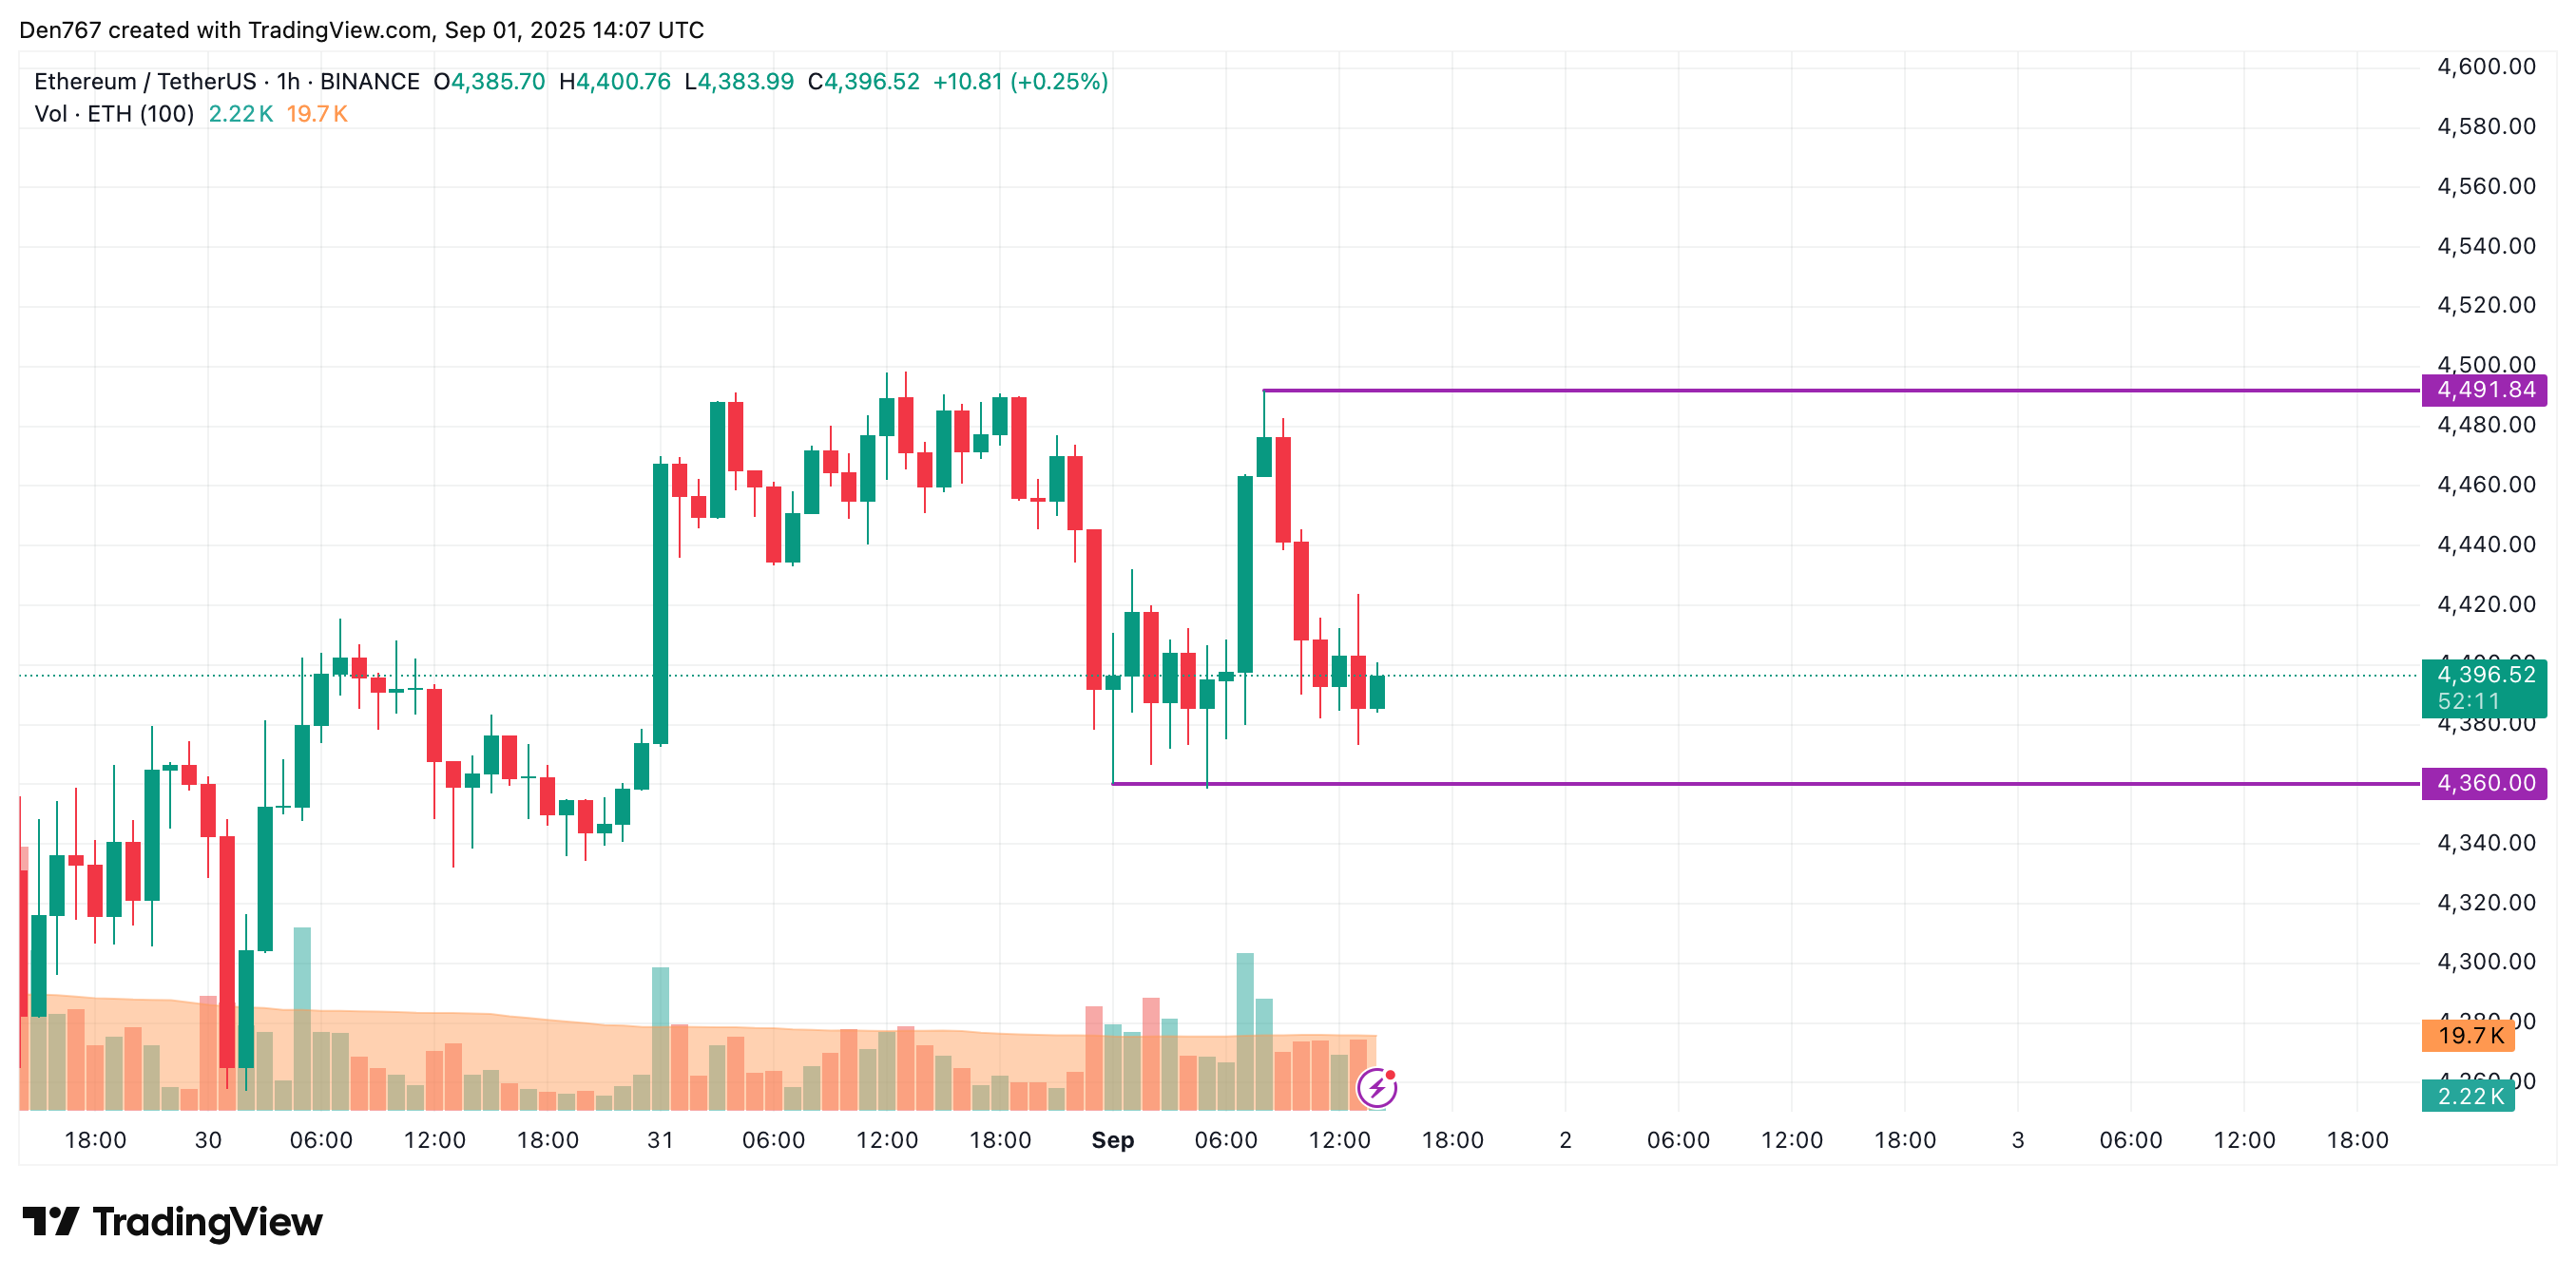
Image by TradingView
How low can ETH fall in the short term?
On the hourly chart, a confirmed daily close below $4,360 raises the chance of a test of the $4,300 zone within 24–48 hours. Support at $4,300 is the next significant technical area; failure there would increase downside risk, while sustained buying above $4,360 would keep the range-bound scenario intact.
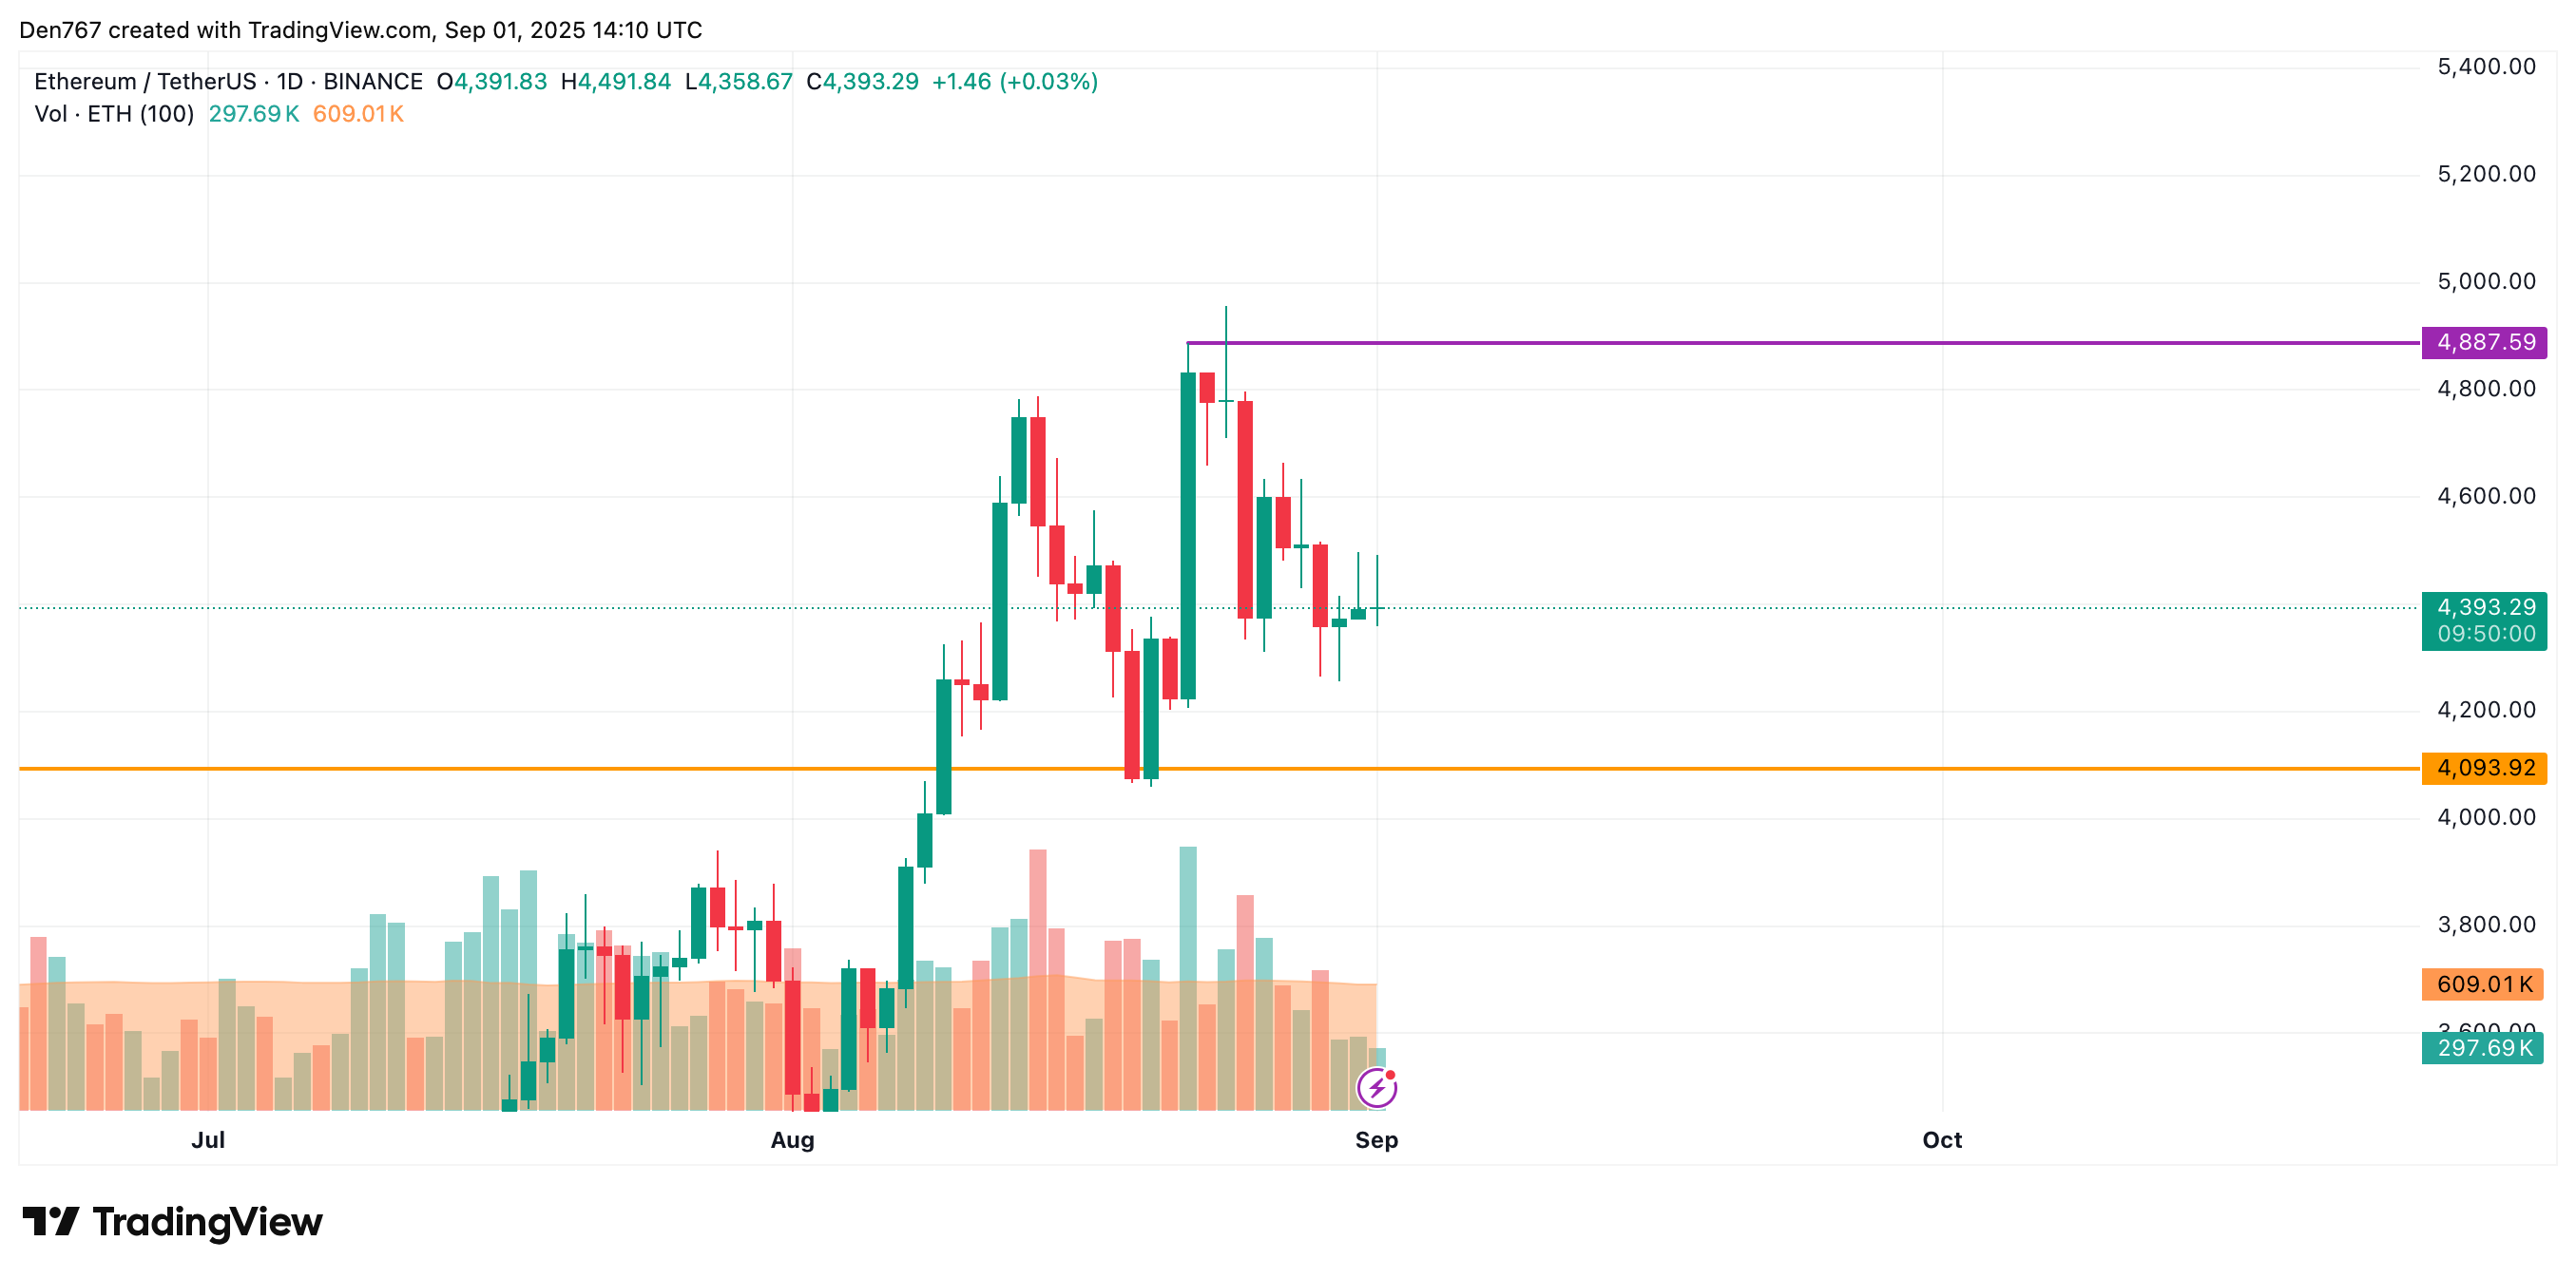
Image by TradingView
On higher timeframes, the picture is muted. ETH price remains distant from broader key levels, indicating neither bulls nor bears have taken decisive control. This lack of directional energy is confirmed by the falling trading volume.
The volume contraction supports the argument for sideways movement around current prices unless a catalyst appears. From a midterm perspective, the week has just begun, and decisive directional signals will depend on volume-confirmed breaks of major zones.
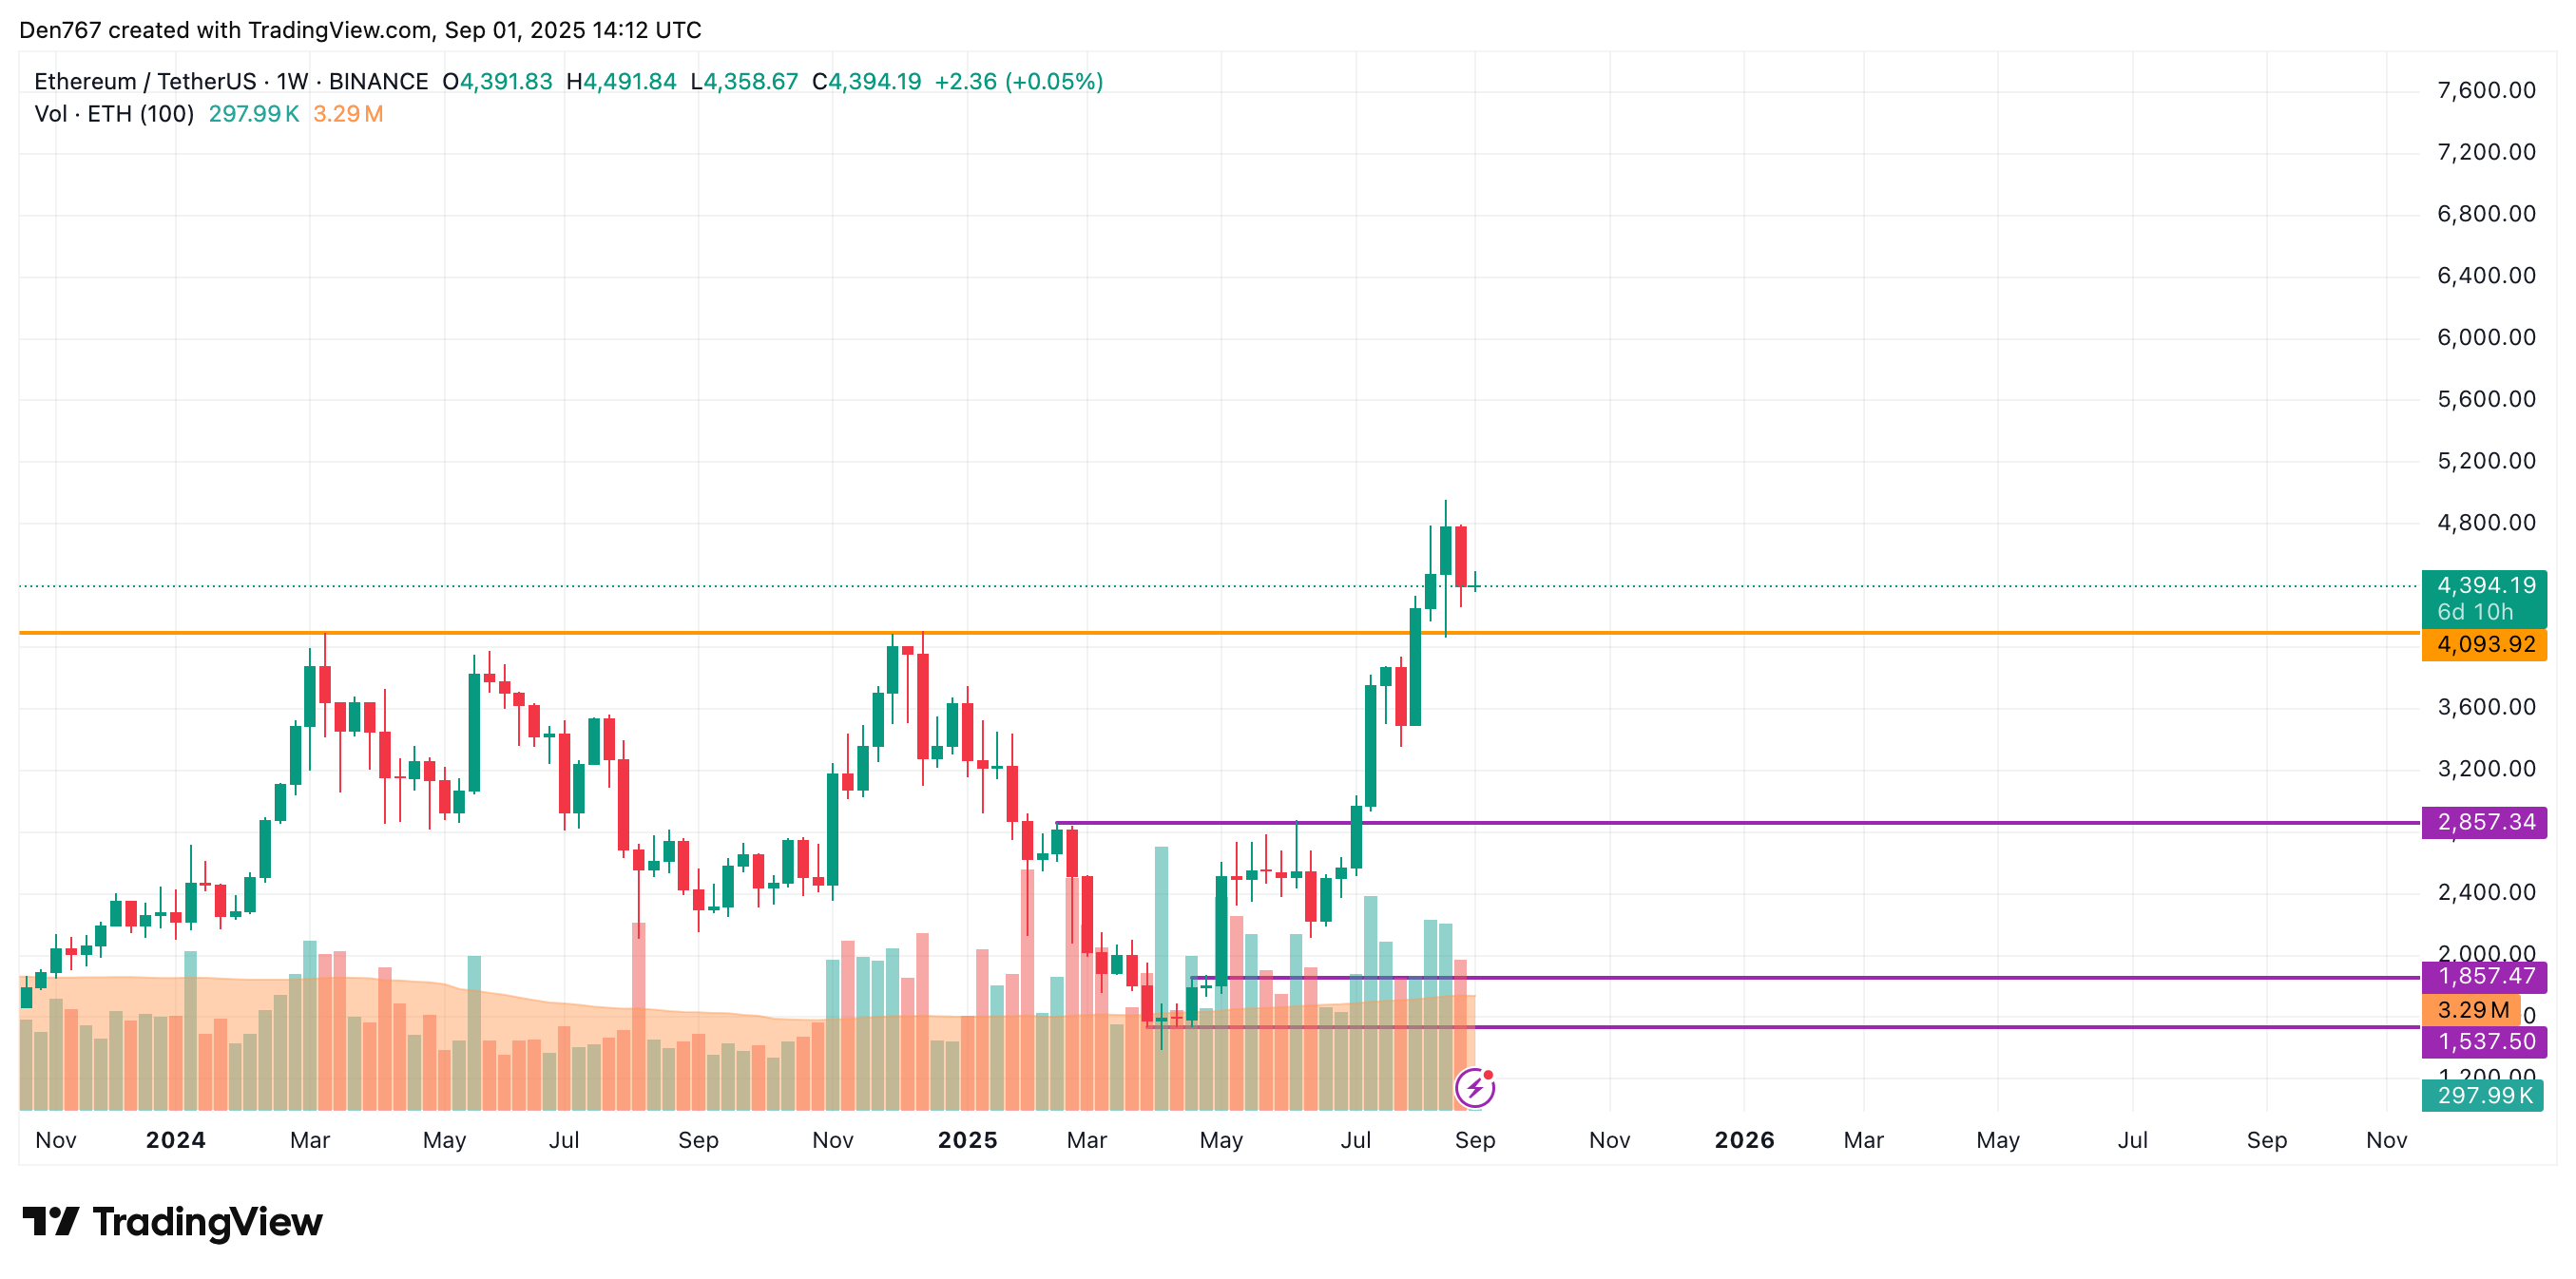
Image by TradingView
Ethereum is trading at $4,394 at press time.
Frequently Asked Questions
What are the key ETH support and resistance levels to watch this week?
Key levels: support at $4,360 (near-term) and $4,300 (secondary). Resistance: $5,000 is a pivotal zone; a close above it would signal renewed bullish potential.
How should traders interpret falling volume on ETH moves?
Falling volume during price moves signals weak conviction and often precedes consolidation. Traders should wait for volume confirmation on breakouts before committing to directional positions.
Key Takeaways
- Current price: ETH at $4,394 — short-term weakness.
- Support & resistance: $4,360 support, $4,300 next downside; $5,000 pivotal resistance.
- Volume signal: Decreasing volume suggests likely sideways trading; watch for volume-confirmed breaks.
Conclusion
This technical update shows the ETH price in a cautious setup: intraday losses and falling volume point to a likely range-bound period unless price closes decisively below $4,360 or rallies above $5,000. Monitor daily closes and volume for confirmation; traders should prepare for both a short-term test of $4,300 and a bullish reversal if key resistance is breached.