XRP Price in Trouble, Bollinger Bands Signal

XRP is finishing August on a negative note, and the latest Bollinger Bands readings suggest the token isn't showing the kind of setup that usually happens before a rally.
On the weekly chart, the coin has slipped from early summer highs near $3.60 and is now holding just barely above $2.80. The middle band, which traders often use to figure out direction, is starting to slope downward.
That's a sign that the overall trend is losing steam.
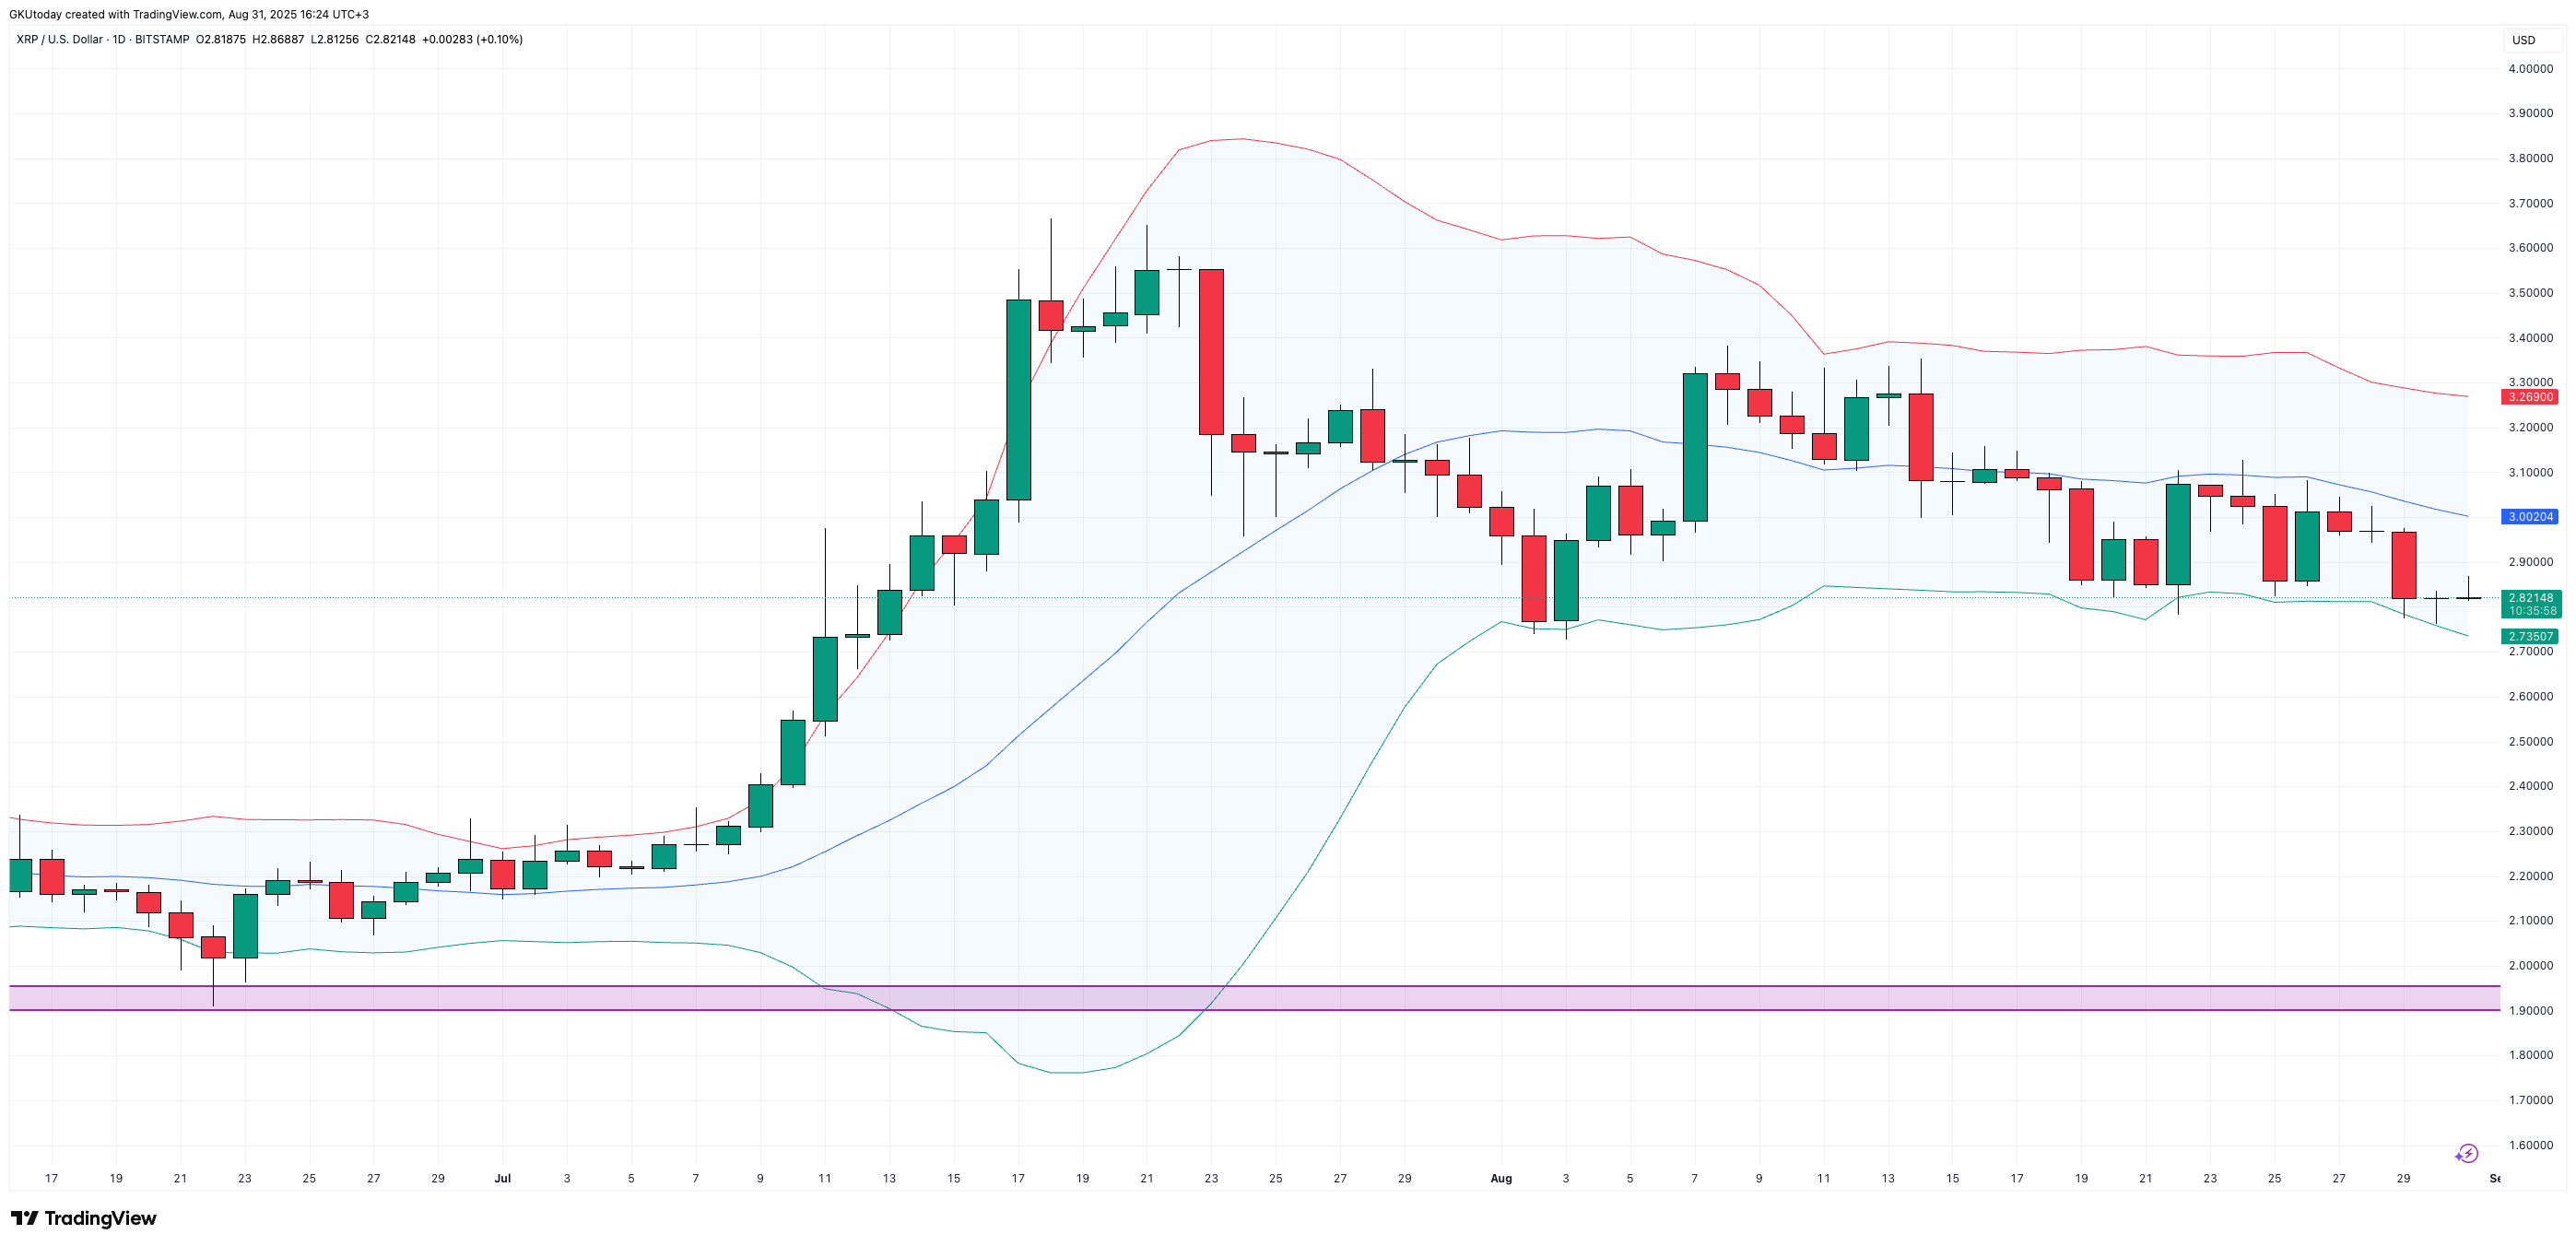
The daily time frame backs that up. For most of August, the XRP price has been stuck below its midline, with each attempt to reach $3.10-$3.20 getting rejected. That left the price action stuck closer to the lower band, where moves tend to indicate weakness rather than strength building.
To put it simply, the range has narrowed, but not in a way that suggests new upside.
More pessimism for XRP
The 12-hour and 4-hour charts tell us the same thing. XRP has been on a bit of a slide, heading toward the $2.70 area. But as soon as it hits the midline barrier, attempts to bounce back quickly fall flat.
Even the 1-hour chart, where sudden reversals often appear, shows more of a slow grind along the lower edge than any rebound worth noting.
All these signals together suggest that the market is having a hard time attracting buyers at higher levels. If the lower band near $2.70 breaks, the next area of interest is closer to $2.40.
On the other hand, if they reclaimed the $3.00 zone, that would be a big sign of strength. For now, though, XRP's Bollinger profile is biased more toward caution than optimism, with sentiment looking more defensive as September trading begins.
Disclaimer: The content of this article solely reflects the author's opinion and does not represent the platform in any capacity. This article is not intended to serve as a reference for making investment decisions.
You may also like
Asia Pioneers Tokenized Islamic Finance Integration

Crypto Markets Remain Resilient Amid U.S. Stock Market Labor Day Closure

XRP and the "Exit Liquidity" Trap: Why Are Long-Term Holders Doomed to Be the Scapegoats?

Solana News Today: Solana's 150ms Finality Revolution: Could It Outrace Ethereum?
- Solana's validator community nears approval of Alpenglow upgrade, slashing block finality to 150ms via Votor and Rotor components. - Upgrade enables 107,540 TPS (vs. Ethereum's 15-45 TPS) and introduces decentralized economic incentives to reduce centralization risks. - 99% voter support with 33% quorum met, positioning Solana to challenge Ethereum in DeFi, gaming, and institutional finance sectors. - Critics warn VAT model may favor large validators, but network's 20+20 resilience model and $8.6B DeFi T