Date: Wed, Aug 27, 2025 | 09:15 AM GMT
The cryptocurrency market is showing notable strength after a choppy week. Ethereum (ETH) briefly dipped to $4,320 before bouncing back to today’s $4,600, which has lifted overall sentiment and supported gains in major altcoins like Sei (SEI).
SEI has turned green today, and its latest chart structure points to the possibility of more upside ahead.
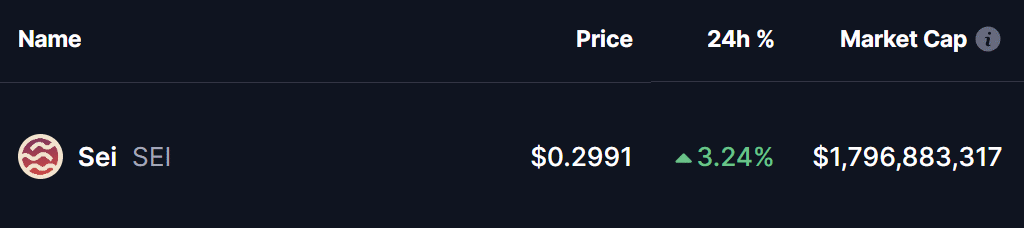 Source: Coinmarketcap
Harmonic Pattern Hints at Potential Upside
On the daily chart, SEI is carving out a Bearish Butterfly harmonic pattern. Despite its name, this setup often produces a bullish continuation in the CD leg, especially when price approaches the Potential Reversal Zone (PRZ).
The move began at point X ($0.3901), retraced to A, rebounded to B, and corrected again down to C ($0.2777). Since then, SEI has recovered steadily and is now trading around $0.2989, showing renewed buying interest.
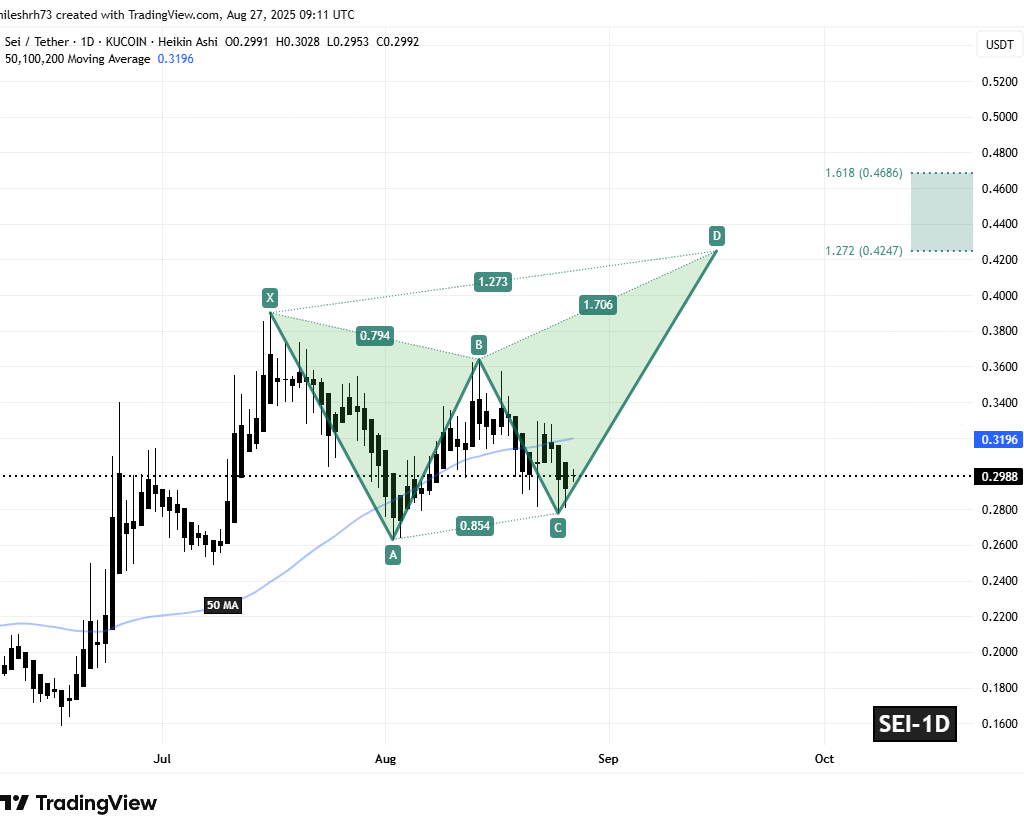 SEI Daily Chart/Coinsprobe (Source: Tradingview)
What makes this structure even more important is SEI’s proximity to its 50-day moving average ($0.3196). Reclaiming this level could flip it into strong support and spark accelerated upside momentum.
What’s Next for SEI?
If buyers continue to defend the C-point support near $0.2770 and manage a breakout above the 50-day MA, SEI could extend its rally into the PRZ between $0.4247 (1.272 Fibonacci extension) and $0.4686 (1.618 extension). These levels mark the typical completion zone for the Butterfly pattern and could act as a magnet for price action in the short term.
On the other hand, a failure to hold above $0.2770 would invalidate the current setup, exposing SEI to further downside pressure.