Date: Sat, Aug 09, 2025 | 09:10 AM GMT
The cryptocurrency market is firmly in bullish mode as Ethereum (ETH) surged past the $4,150 mark for the first time since 2021. This 6% daily jump has ignited a broader rally, lifting major memecoins — including Pepe (PEPE).
PEPE has impressed with an 10% spike in the past 24 hours, and its price chart is now flashing a familiar harmonic setup that could hint at where it’s headed next.
 Source: Coinmarketcap
Harmonic Pattern Hints at Potential Bounce
On the daily timeframe, PEPE is shaping up a Bearish ABCD harmonic pattern — a classic formation that, despite the bearish label, often features a bullish CD leg before price reaches the potential reversal zone (PRZ).
The move began with a strong push from point A near $0.00000831 to point B, followed by a pullback to point C around $0.00001004, where buyers stepped back in. Since then, the price has rallied again and is now hovering near $0.00001232, confirming that the CD leg is in progress.
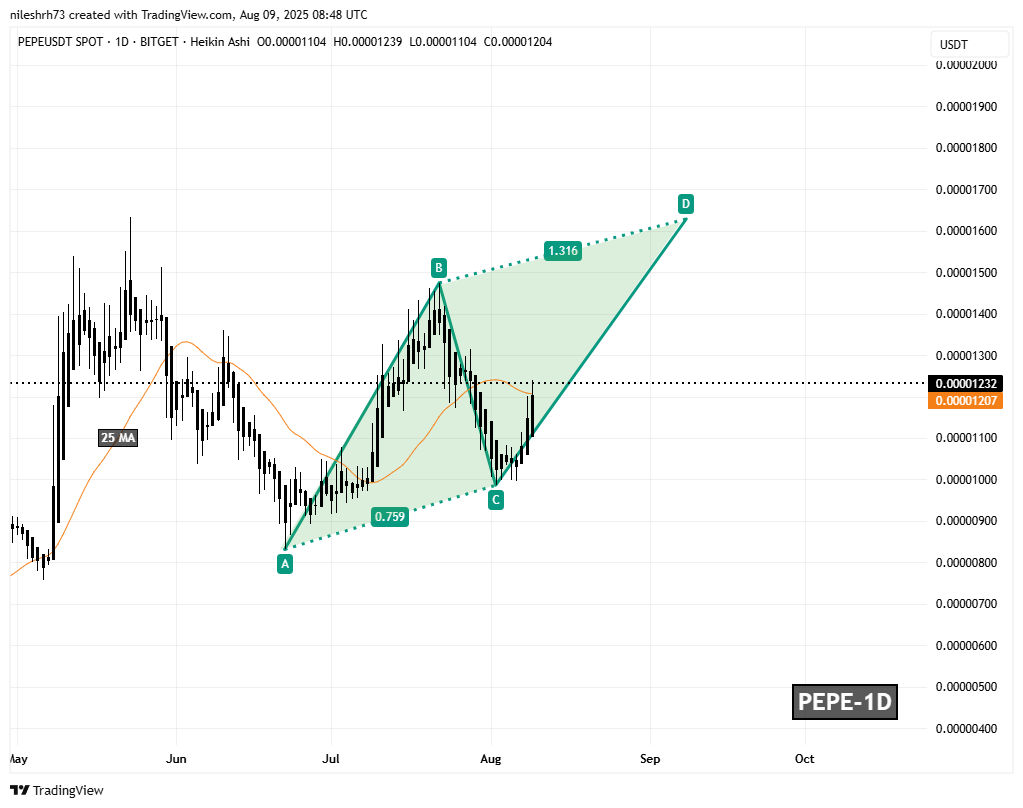 Pepe (PEPE) Daily Chart/Coinsprobe (Source: Tradingview)
According to harmonic projections, the CD leg could extend toward the 1.31 Fibonacci extension of the BC leg, setting up a PRZ around $0.00001628. If hit, this would translate to roughly a 32% upside from current levels.
What’s Next for PEPE?
Momentum currently leans in the bulls’ favor. A sustained move toward the $0.00001628 target would complete the ABCD pattern, though this area could also become a major resistance level where traders might take profits.
On the flip side, PEPE needs to maintain support above its 25-day moving average — now around $0.00001207. Losing this level could undermine the bullish setup and open the door to deeper consolidation.