Date: Fri, Aug 08, 2025 | 02:06 PM GMT
The cryptocurrency market is once again buzzing with bullish sentiment as Ethereum (ETH) reclaims the $3,975 level — a price not seen since late 2024. This 3% daily surge has ignited momentum across altcoins , including Render (RENDER), which is showing signs of life after lagging in previous weeks.
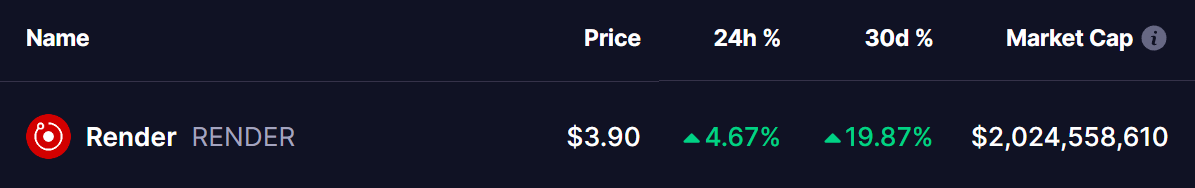
RENDER has turned green with an 4% daily jump, extending its monthly gains to over 19%. However, its current chart structure reveals a familiar price behavior, which may offer clues about its next move.
 Source: Coinmarketcap
Familiar Pattern Hints at Potential Pullback
Looking at the daily chart, RENDER appears to be moving inside a falling wedge pattern — typically a bullish structure in the longer term. However, in the short term, a more cautionary signal is emerging through a repeating fractal pattern.
Back in early June, RENDER made a bearish moving average (MA) crossover, highlighted by a blue circle. At that time, price failed to hold support above the 100-day and 25-day moving averages, triggering a steep 34% drop to the lower wedge support near $2.75.
Now, the price is showing eerily similar behavior.
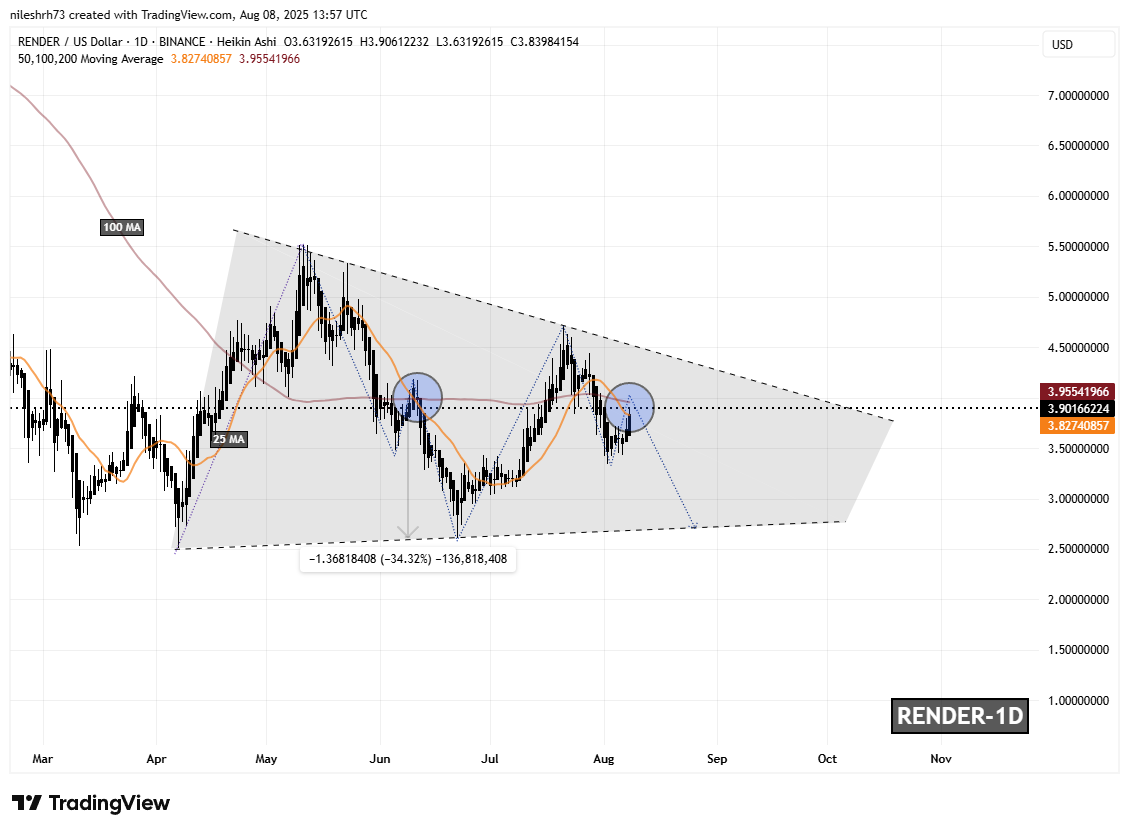 Render (RENDER) Daily Chart/Coinsprobe (Source: Tradingview)
Once again, RENDER is hovering just below the 25-day and 100-day MAs, following a second bearish crossover — marked by another blue circle — hinting at a potential repeat of the previous decline.
What’s Next for RENDER?
If this fractal continues to mirror the past, RENDER could still push slightly higher toward the 100-day MA, currently near $4.10, before facing a potential breakdown. A decisive rejection and close below this zone could act as the catalyst for another correction, possibly sending the price back toward the lower wedge trendline around $2.70 — a drop of approximately 30% from current levels.
However, there’s still hope for bulls. If RENDER manages to hold above the 100-day MA and breaks out of the wedge to the upside, it would invalidate the bearish setup and open the door for a larger upward move.