Date: Fri, Aug 08, 2025 | 07:56 AM GMT
The cryptocurrency market is flashing bullish signals as Ethereum (ETH) reclaims the $3,900 mark for the first time since late 2024. This 6% daily jump has sparked a broader rally, lifting several major altcoins — including Sui (SUI).
SUI has turned green with an impressive 9% daily jump, extending its monthly gains to over 31%. However, its current chart structure reveals a familiar price behavior, which may offer clues about its next move.
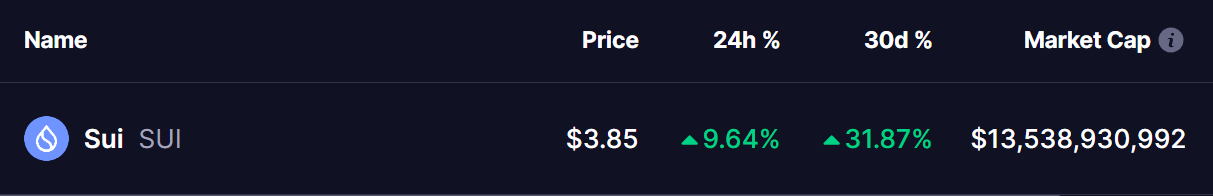 Source: Coinmarketcap
Familiar Pattern Hints at Potential Pullback
On the daily timeframe, SUI appears to be trading within a rising wedge — a pattern often associated with slowing bullish momentum and potential reversals.
Looking at the chart, we see a repetitive fractal pattern forming. In the previous cycle, SUI rallied after making a bullish moving average crossover (marked by the blue circle), pushing the price to the upper wedge resistance. However, this was followed by a breakdown below the 25-day MA (marked in red), leading to a sharp drop to the 100-day MA (green circle). From there, SUI found temporary support before dropping further to the lower wedge trendline — registering a correction of roughly 34%.
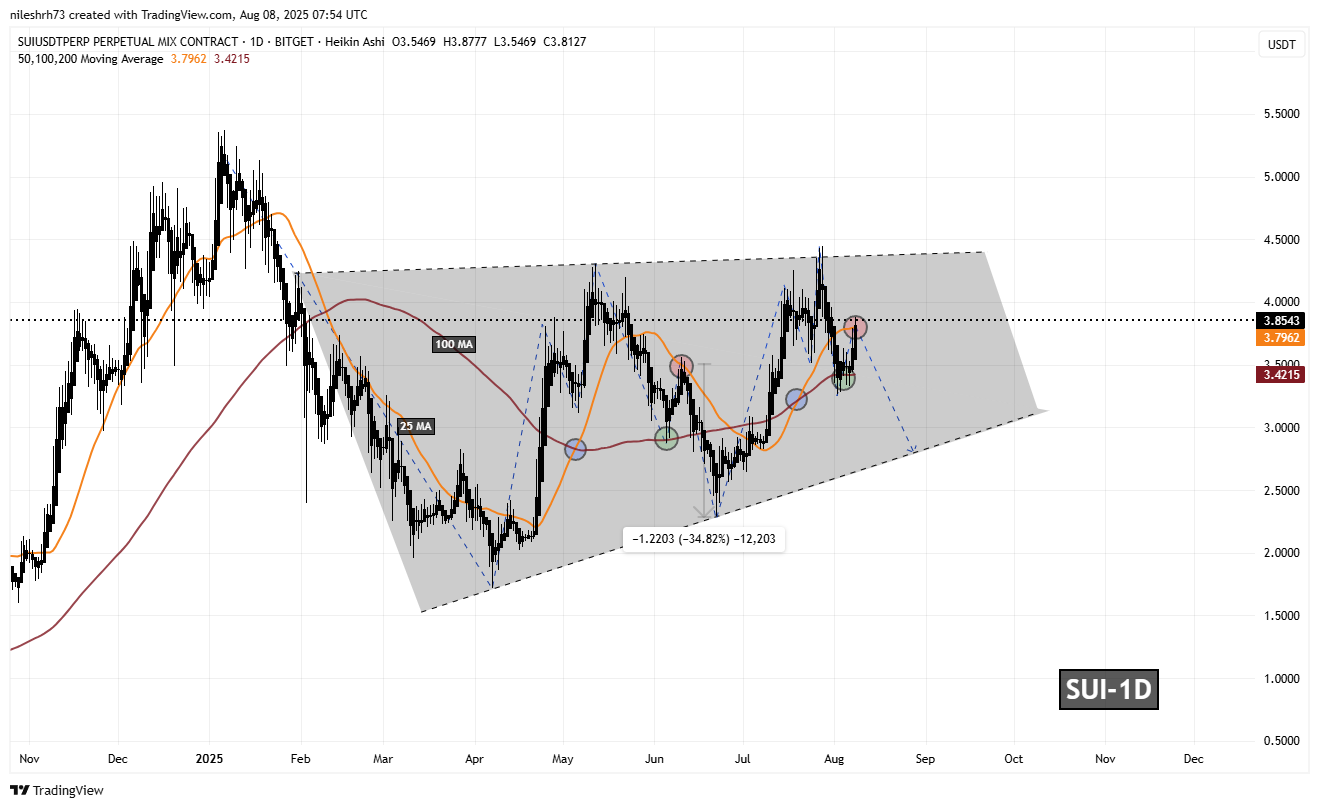 Sui (SUI) Daily Chart/Coinsprobe (Source: Tradingview)
Fast forward to the present, and SUI seems to be repeating the same structure.
It recently bounced off the 100-day MA and has now reclaimed the 25-day MA — once again marked by a red circle, placing the asset in a similar position to its last breakdown.
What’s Next for SUI?
If this fractal pattern continues to unfold, a breakdown below the 25-day MA support at $3.79 would act as confirmation. This would open the door for a drop toward the 100-day MA at $3.42, and possibly a further decline toward the wedge’s lower trendline near $2.80 — representing a 26% drop from current levels.
However, if bulls manage to hold the 25-day MA, this would invalidate the bearish scenario and signal strength. In this case, SUI could climb higher, potentially retesting the upper resistance of the wedge around $4.40.
Final Thoughts
SUI is at a critical juncture, mirroring past price action with uncanny accuracy. Whether it repeats its prior drop or breaks out of the pattern will depend on how it reacts around the 25-day moving average. Traders should closely monitor these technical levels in the coming days.