Date: Fri, Aug 01, 2025 | 06:25 PM GMT
The cryptocurrency market is in the midst of a broad correction after Ethereum (ETH) faced rejection near the $3,940 level and slid down to $3,540—marking a sharp 5% daily decline. This weakness has spilled over to memecoins , with SPX6900 (SPX) dropping 9% on the day and paring back its monthly gains to 24%.
However, beneath the short-term bearish surface, SPX’s daily chart suggests a potentially bullish setup might be playing out.
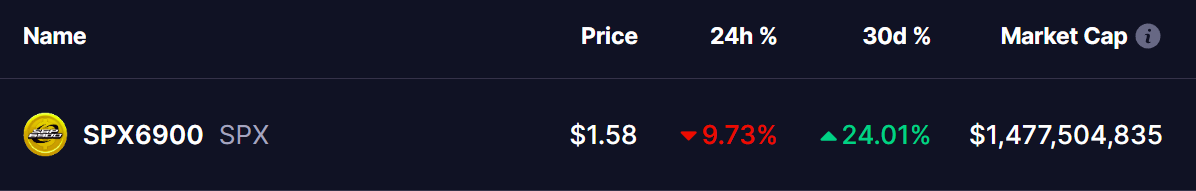 Source: Coinmarketcap
Retesting Cup and Handle Breakout
A closer look at the SPX daily chart reveals a textbook Cup and Handle formation — a classic bullish continuation pattern that typically precedes major upward moves.
The “cup” structure began taking shape early this year with a steep decline from the $1.70 zone, bottoming near $0.25. Since then, SPX has steadily recovered, carving out a rounded base and transitioning smoothly into the “handle” phase in June. A strong breakout followed in mid-July, lifting the price above the neckline resistance area around $1.64–$1.75, pushing SPX as high as $2.28.
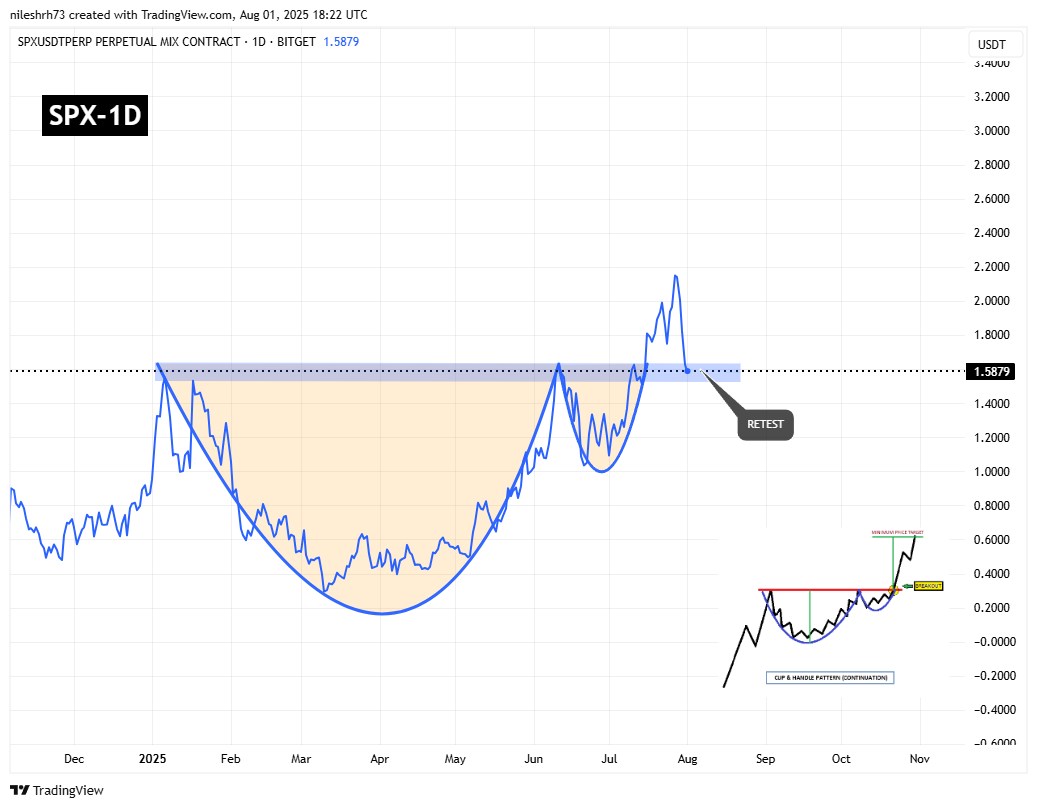 SPX6900 (SPX) Daily Chart/Coinsprobe (Source: Tradingview)
In recent sessions, SPX has pulled back, now hovering near $1.58, right around the breakout zone. This retest of former resistance as new support is a key technical event, often acting as a launchpad for renewed bullish momentum if it holds.
What’s Next for SPX?
If the neckline support holds firm and demand picks up again, SPX could be poised for its next move upward. A breakout above the $2.28 peak would likely confirm a continuation, with a measured move target from the depth of the cup projecting a run toward $3.20 — a potential 100%+ upside from current levels.
While short-term volatility remains a risk, the broader structure stays bullish as long as SPX maintains price action above its retest zone.