Date: Wed, July 30, 2025 | 02:55 PM GMT
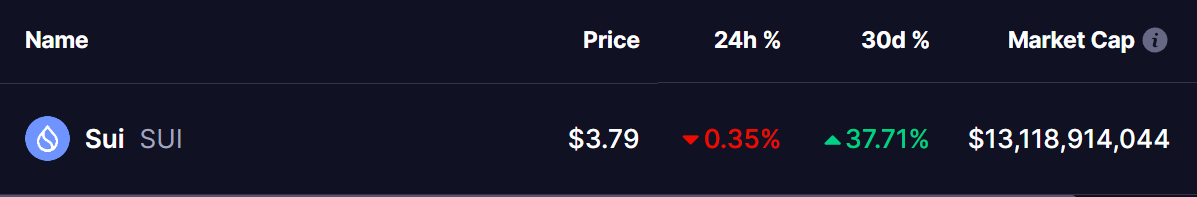
The cryptocurrency market is going through a corrective phase after Ethereum (ETH) tested its multi-year resistance near $3,940 before slipping back to current price of $3,800. This pullback, paired with the anticipation of the upcoming FOMC meeting, has put pressure on several major altcoins. Among them, Sui (SUI) has cooled down to $3.79 from its recent high of $4.44.
 Source: Coinmarketcap
Yet, despite the dip, technical patterns suggest SUI may be preparing for a potential bounce back.
Harmonic Pattern Hints at Bullish Continuation
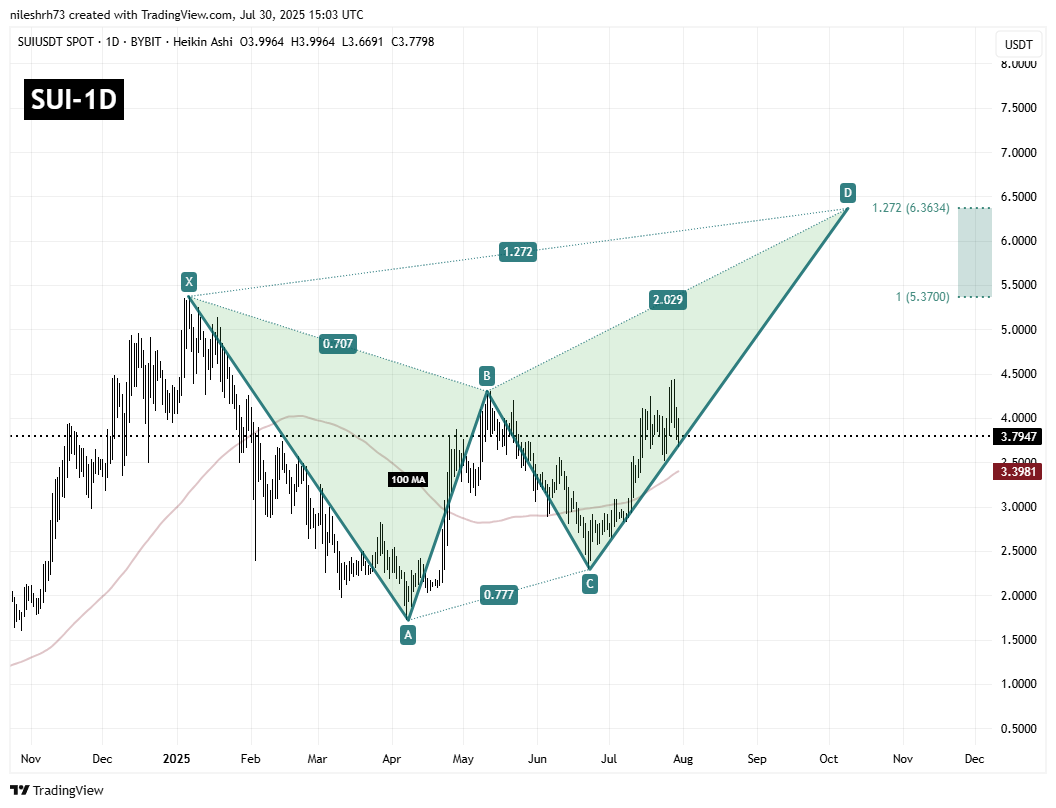
On the daily chart, SUI is forming a Bearish Butterfly harmonic pattern. Interestingly, despite its bearish-sounding name, this setup often forecasts powerful rallies during the CD leg, which is typically the most explosive part of the move.
The structure began when price touched point X near $5.36, followed by a decline to point A and a subsequent rebound to point B. After a corrective move lower to point C at $2.29, Sui has since turned higher and is now trading close to $3.79.
 Sui (SUI) Daily Chart/Coinsprobe (Source: Tradingview)
This level also aligns with the lower edge support of the pattern, suggesting the CD leg is well underway and potentially preparing for a continuation to the upside if hold.
What’s Next for SUI?
If the pattern continues to unfold, the lower edge support of the pattern could mark the foundation for Sui’s next upside leg. The first major target sits around $5.37, which corresponds with the 1.0 Fibonacci extension of the XA leg. Beyond that, the pattern projects a move toward $6.36, the 1.272 Fibonacci extension, which would represent a rally of more than 66% from current prices.
Still, caution is warranted. A failure to hold above the $3.70 area could open the door for a retest of the 100‑day moving average near $3.39, a level that must remain intact to preserve the bullish scenario.
While the broader market awaits clarity from the FOMC, the technical outlook for Sui (SUI) remains constructive.