- SPX6900 price is showcasing extreme bearish pressure on the daily timeframe.
- SPX price is down by 17% in the last 24 hours, indicating bearishness.
The bearish phase of SPX6900 has become a matter of concern as it has been rejected strongly at the resistance level of $2.2787, which is a major change in the market sentiment. The recent price action of the cryptocurrency shows that there are several technical indicators that are pointing in the same direction to show that there is still downward pressure in the short-term. Moreover, as per CMC data, the SPX price is down by almost 17% in the last 24 hours, suggesting bears are trying to grab control from bulls.
The present price set up indicates that SPX6900 is trading below its 50-day EMA at $1.556,8, which has now turned into a vital support. The 50-day EMA has served as a dynamic support in the bullish rally between May and July, but the recent drop shows that the momentum is fading. What is more alarming is the gap between the current price and the 50-day EMA level, which is too close. However, the 200-day EMA level may become the next significant support area in case the selling pressure increases.
The technical indicators are telling a rather bearish story. The MACD histogram has become red, and the crossover is bearish, which means that the selling pressure is building up. This crossover was seen when the MACD lines were at high levels on the recent peak, indicating that the bullish trend has run out. The RSI, which is at 45, is moving downwards out of the overbought range, which means that the buying pressure is fading and the bears are taking over.
What Next For SPX6900 Price?
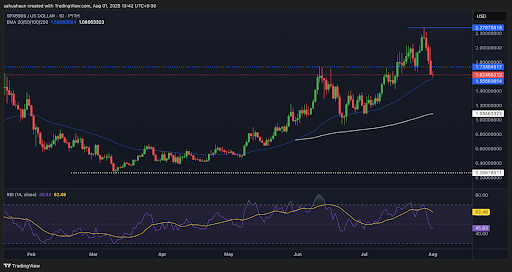 Source: Tradingview
There is an additional layer of concern, which is social sentiment analysis, where the indicator indicates negative readings. The social sentiment threshold analysis shows the red bars dominating in the recent periods, which indicates that the market participants are getting more and more pessimistic about the future of SPX6900 . This pessimistic feeling can easily turn self-fulfilling since it affects the decision to trade and may increase selling pressure.
The most important support point to observe is at $1.556, which is also the 50-day EMA. A resolute break below this level may initiate additional selling to the 200-day EMA at $1.0856. On the other hand, in the case of any bullish reversal efforts, SPX6900 would have to bounce from $1.5567 level and finally test the resistance of $2.2787, where it was rejected before.
At this point, risk management is paramount, with the combination of bearish technical signals, bearish social mood, and the rejection of the main resistance, the path of least resistance is still to the downside in SPX6900.
Highlighted Crypto News Today:
Hedera Takes a Hit, Is $0.24 the Bounce Point or Just a Pitstop on the Way Down?