

Date: Fri, July 25, 2025 | 12:48 PM GMT
The cryptocurrency market is seeing heightened volatility after a multi-week rally, with Ethereum (ETH) pulling back to $3,700 from its recent peak of $3,875. This broader correction has also weighed on major altcoins , including Solana (SOL), which is trading slightly lower today.
However, beneath the short-term weakness, a bullish fractal pattern is emerging — one that closely mirrors the breakout structure recently seen in SEI.
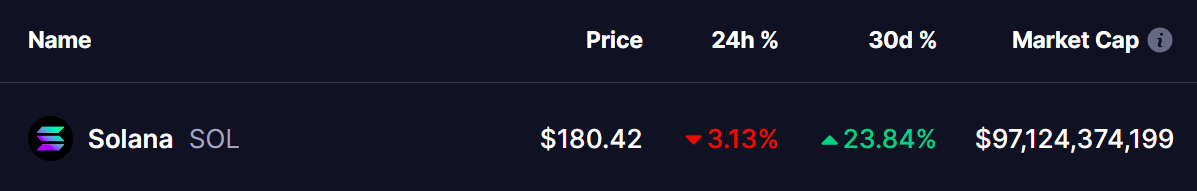 Source: Coinmarketcap
SOL Mirrors SEI’s Breakout Setup
A comparison of daily charts for SOL and SEI highlights a strikingly similar formation.
Earlier this year, SEI broke out from a textbook ascending triangle — a classic bullish continuation pattern. Following the breakout, SEI briefly retested its breakout trendline before igniting a sharp rally, climbing as much as 55% in its next upside leg.
Now, SOL is showing a nearly identical setup.
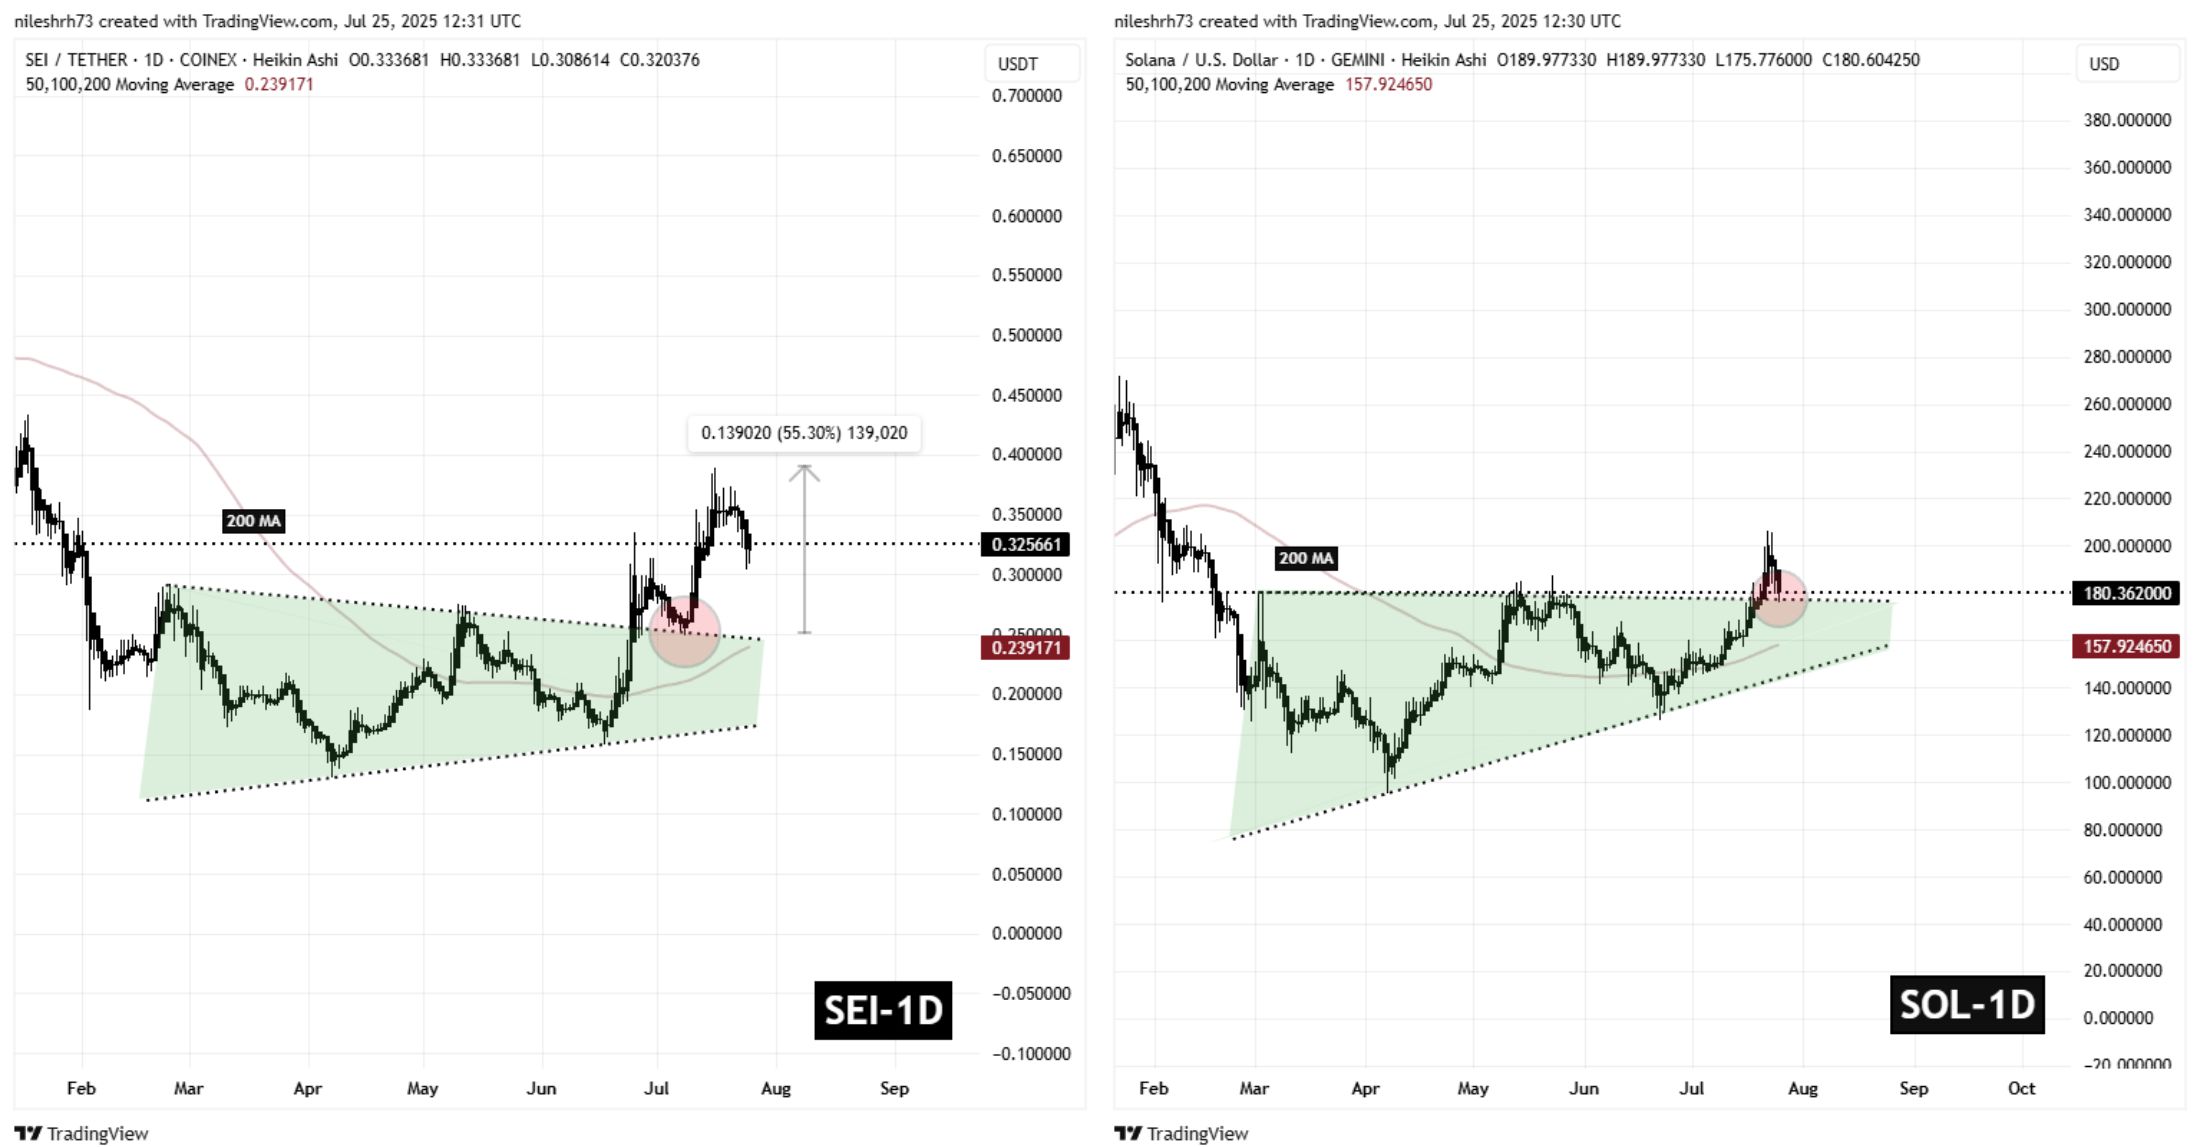 SEI and SOL Fractal Chart/Coinsprobe (Source: Tradingview)
The token recently broke out of its own ascending triangle, surging to a local high of $206 before undergoing a correction. During the pullback, SOL retested its breakout trendline, dipping to $175 before stabilizing near its current level of $180. This consolidation phase mirrors SEI’s structure right before it launched its strong upward move, suggesting SOL could be gearing up for a similar bounce.
What’s Next for SOL?
If this fractal pattern continues to unfold, SOL may be on the verge of a rebound. A confirmed breakout above its recent high of $206 could pave the way for a move toward $244 and potentially $271 — representing nearly a 50% upside from the current price.
However, as with any fractal-driven projection, confirmation is crucial. Traders should watch for sustained momentum above $206 before considering bullish positions.