Solana (SOL) Just Flashed a 5-Year Bullish Signal; Could a Breakout Be Next?

SOL price is hovering near $148 just as its transaction count flips above price for the first time since 2020. With net outflows steady, SOPR under 1, and MACD signaling a reversal, the setup hints at a potential breakout from the falling wedge.
Solana just printed a rare crossover between a key network metric and SOL price, something that hasn’t happened since the early days of its first bull run in 2020. But this time, the price is lagging behind, even as the network shows renewed strength.
Could this be the signal that lights the next leg up?
Transaction Count Hits 5-Year High, But SOL Price Isn’t Following Yet
Solana’s number of transactions has surged past 70 million. Yet, that is not the best part.
According to the chart, the last time the transaction count line crossed above the price line, a multi-year SOL price rally occurred. This time, in July 2025, the price remains sluggish, around $151, and a similar crossover has happened.
 SOL price and transaction count crossover:
SOL price and transaction count crossover.
SOL price and transaction count crossover:
SOL price and transaction count crossover.
Netflows Tilt Bearish, Despite Exchange Exits
Data from Coinglass shows Solana has seen steady outflows through early July. That usually points to accumulation. But the outflows have slowed down in recent days, and there’s no spike in inflows either.
In short, no one’s dumping SOL, but no one’s rushing to buy either.
This balance may explain why the SOL price hasn’t broken out yet. Traders seem to be waiting for a stronger signal before taking a side.
 SOL price and netflow:
Netflow chart.
SOL price and netflow:
Netflow chart.
SOPR Flips Below 1; Sign of Panic?
Solana’s Spent Output Profit Ratio (SOPR), which tracks whether coins are being sold at a profit or loss, has hovered just below 1.0 since late June. That typically means holders are selling at a loss or break-even, often seen during market bottoms.
When SOPR drops below 1, it shows capitulation; traders are exiting positions at a loss. But when SOPR starts to rise again toward 1, it suggests most panic sellers are gone, and only long-term or break-even holders remain.
 SOL price and SOPR:
SOPR indicator.
SOL price and SOPR:
SOPR indicator.
In this case, SOPR rising from 0.95 back toward 1.0 indicates that forced selling may be cooling off. Combined with the slowing exchange outflows, it suggests Solana is stabilizing, or rather, the bottom for this cycle might be forming.
SOL Price Structure: Falling Wedge Still in Play, But Momentum Lags
The Solana price has stayed locked inside a broad falling wedge since early January 2025. The structure is still intact, but SOL has tested the upper trendline multiple times without a breakout. That line now sits just under $155, and the price has been hovering close without clearing it.
 Solana price analysis:
Chart analysis.
Solana price analysis:
Chart analysis.
A confirmed move above $155 could shift the momentum. If that happens, upside targets sit at $169 and $180, both acting as major resistance zones from prior highs.
But if bulls fail to break the wedge, there’s a risk of sliding back into the old sideways band. This support zone between $140 and $125 has trapped the SOL price before. Losing that zone would weaken the entire structure and possibly lead to deeper losses. The wedge is wide enough that even smaller dips won’t break the setup, but if SOL drops below $125, the pattern may no longer hold weight.
 SOL price and MACD:
MACD overview.
SOL price and MACD:
MACD overview.
Supporting the pattern is the Moving Average Convergence Divergence (MACD), trying to turn bullish. The MACD line (blue) has flipped above the signal line (orange), a classic early momentum indicator. The flip happened near a swing low, confirming bullish strength and a bottoming attempt, also indicated by SOPR.
But here’s the catch: the histogram bars, which represent the distance between the two lines, are fading. That signals a weakening upside momentum.
MACD is a momentum indicator that helps spot early trend reversals based on two moving lines and a histogram.
Solana is trading near $151. Unless it decisively breaks the $155, the falling wedge stays in control.
Disclaimer: The content of this article solely reflects the author's opinion and does not represent the platform in any capacity. This article is not intended to serve as a reference for making investment decisions.
You may also like
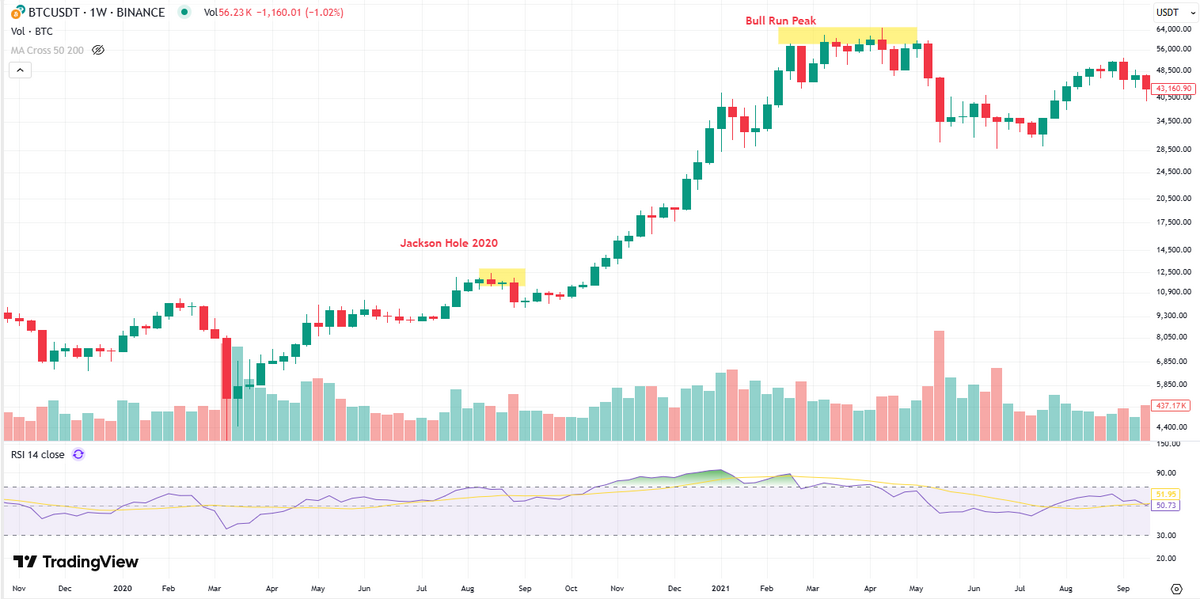
Jackson Hole 2025: Will Powell Spark Another Crypto Bull Run?
Kanye West YZY memecoin hits $3B, but falls after insider concerns
Asian markets remained mixed while oil extends gains into second day
Share link:In this post: Asian markets stayed mixed as investors await signals on US interest rates, while EU stocks slipped. Oil prices rose for a second straight day after US crude stockpiles fell sharply and gasoline supplies kept dropping. Brent crude stayed above $67 a barrel but remains down over 10% this year with oversupply fears lingering.
US and European Union have reached a trade deal – Here are the terms
Share link:In this post: The US and European Union have finalized a trade deal, easing tariff tensions and securing new commitments on industrial and agricultural goods. Washington agrees to lower auto tariffs to 15% once Brussels enacts reductions, while Europe pledges $750B in US energy purchases. The pact also covers digital trade, climate rules, and sustainability regulations, aiming to prevent barriers for transatlantic businesses.