

Date: Sat, June 14, 2025 | 07:25 AM GMT
The cryptocurrency market has recently faced a significant pullback amid rising geopolitical tensions between Israel and Iran. Ethereum (ETH) alone has dropped over 8% in last 32 days, now hovering near $2,550. Naturally, this volatility has impacted altcoins — including Ondo (ONDO), a prominent RWA (Real World Assets) token.
ONDO is down by 5% in the past week, deepening its 30-day decline to 19%. However, a closer look at the daily chart tells a very different story. In fact, a bullish fractal pattern — almost identical to a previous breakout — may suggest that this dip is a best accumulation opportunity.
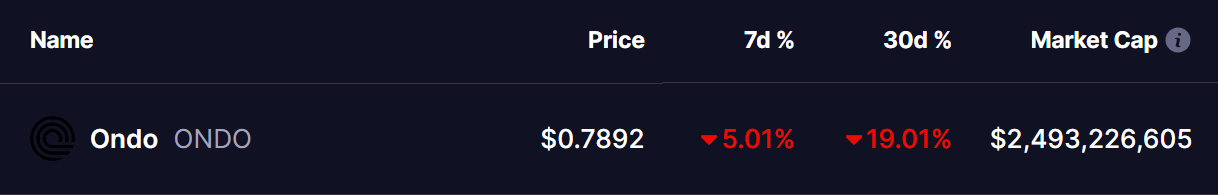 Source: Coinmarketcap
Breakout Fractal Setup Hints Upside
The daily chart of ONDO reveals a powerful pattern playing out. Back in late 2024, ONDO consolidated inside a descending structure, tapping into a long-standing demand zone around $0.40-$0.45. After multiple retests and compression below key moving averages, the token exploded 261%, peaking around $1.55.
Fast forward to today: ONDO is once again mimicking that setup.
- Same descending resistance line
- Same confluence of moving averages (20, 100, and 200 SMA)
- Same accumulation zone
- Same red circle retest area, signaling a potential launchpad
What stands out most is the current candle formation inside the demand zone — coupled with a clear test of the 200 SMA — exactly like the November 2024 breakout. If the fractal repeats, ONDO could target $2.70, representing another 261% surge from current levels like previous breakout rally.
What’s Next for ONDO?
If ONDO can hold above the $0.73-$0.80 range and start pushing past the 20 and 100-day SMAs, it may trigger an aggressive upside move. The next key level is around $0.88 (200 SMA) — flipping that into support would further validate the bullish fractal.
A breakout beyond the current downtrend line could fuel a move toward the $1.20-$1.40 zone in the short-to-mid term, with the full $1.94 fractal target in sight if momentum continues.
Final Words
While ONDO’s recent dip might look bearish on the surface, zooming out reveals a high-potential bullish fractal — just like the last explosive breakout. If history rhymes, this could be a rare accumulation opportunity before a major upside move.
Disclaimer: This article is for informational purposes only and does not constitute financial advice. Always conduct your own research before making any investment decisions in cryptocurrencies.