Dogecoin Breaks $0.20: Is a 30% Rally Coming Next?

Dogecoin (DOGE) price has just crossed a critical psychological level of $0.20, and both the hourly and daily charts suggest this move might not be a fluke. The Dogecoin price appears to be breaking out from a consolidation phase , potentially setting itself up for a strong move toward the $0.26–$0.28 range in the coming days. Let’s dig into the charts to understand why this breakout could be just the beginning.
Dogecoin Price Prediction: What Does the Hourly Chart Reveal?
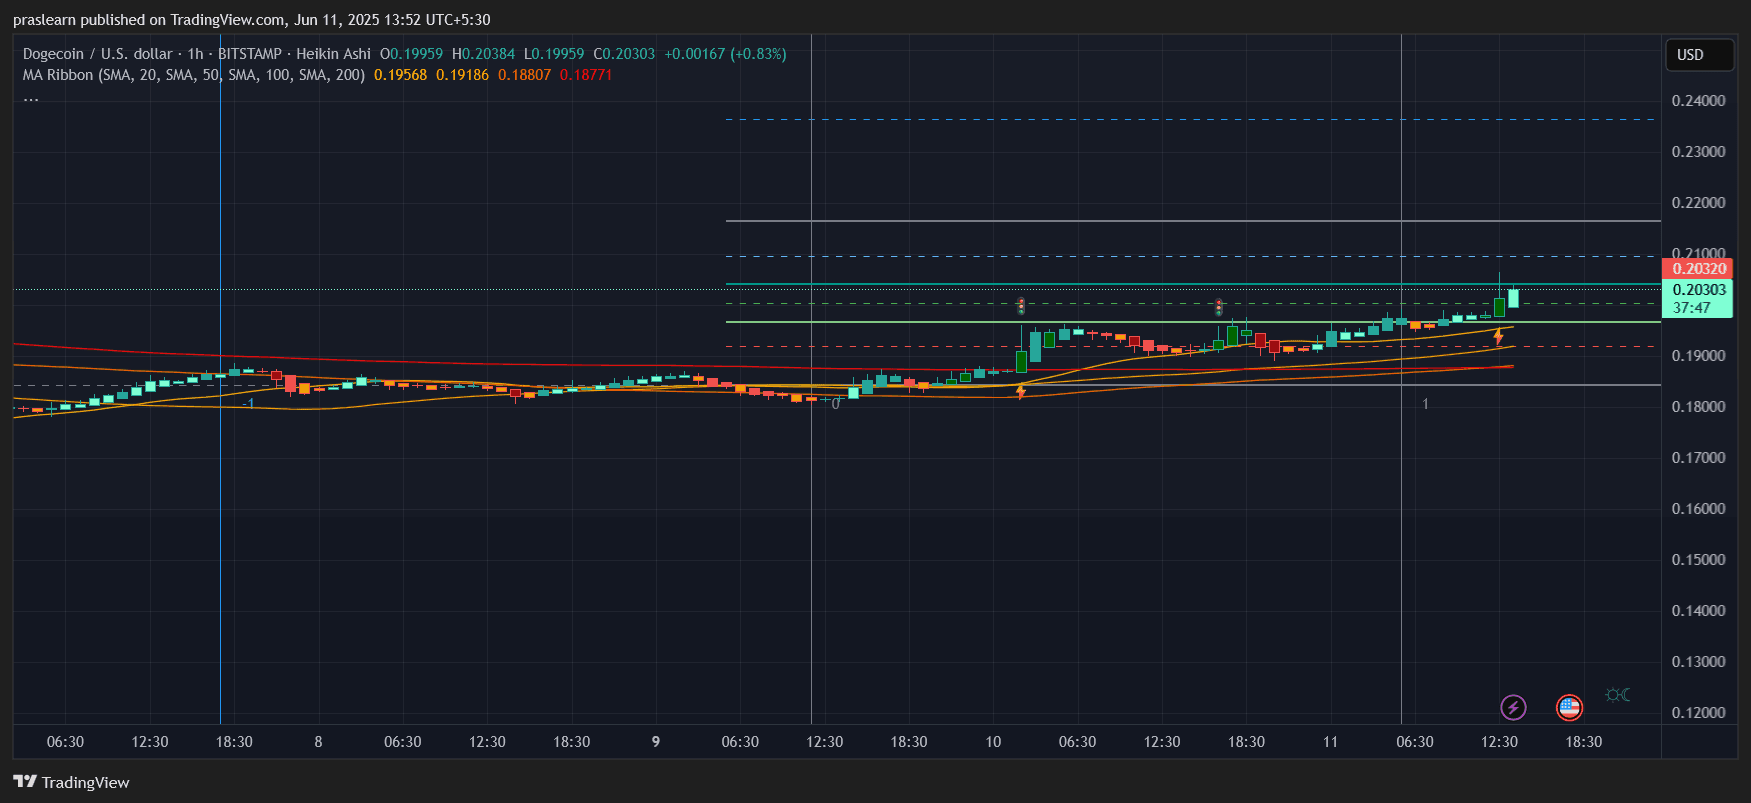 DOGE/USD 1 Hr Chart- TradingView
The 1-hour Heikin Ashi chart shows that DOGE price recently broke through local resistance at $0.20 with rising momentum. This level had acted as a ceiling for several days, and the breakout was supported by higher lows, forming an ascending triangle—one of the most bullish intraday setups.
The Moving Average (MA) Ribbon (20, 50, 100, 200 SMA) is now stacked in bullish order with the 20 SMA at $0.195 and the 200 SMA trailing lower at $0.187. This alignment confirms a near-term uptrend. The price is currently hovering around $0.203 with low selling pressure and strong Heikin Ashi green candles, hinting that bulls are firmly in control.
Also, Fibonacci retracement levels from the recent swing high around $0.21 to swing low near $0.18 show that DOGE has reclaimed the 0.618 golden zone and is now testing the 0.786 level, commonly a launchpad for accelerated moves.
If this breakout sustains, the next resistance lies for Dogecoin price around $0.21. A clean break above that could trigger a quick surge toward $0.23 and even $0.26.
📊 Buy DOGE on Bitget
Daily Chart Analysis: Bigger Picture Turning Bullish?
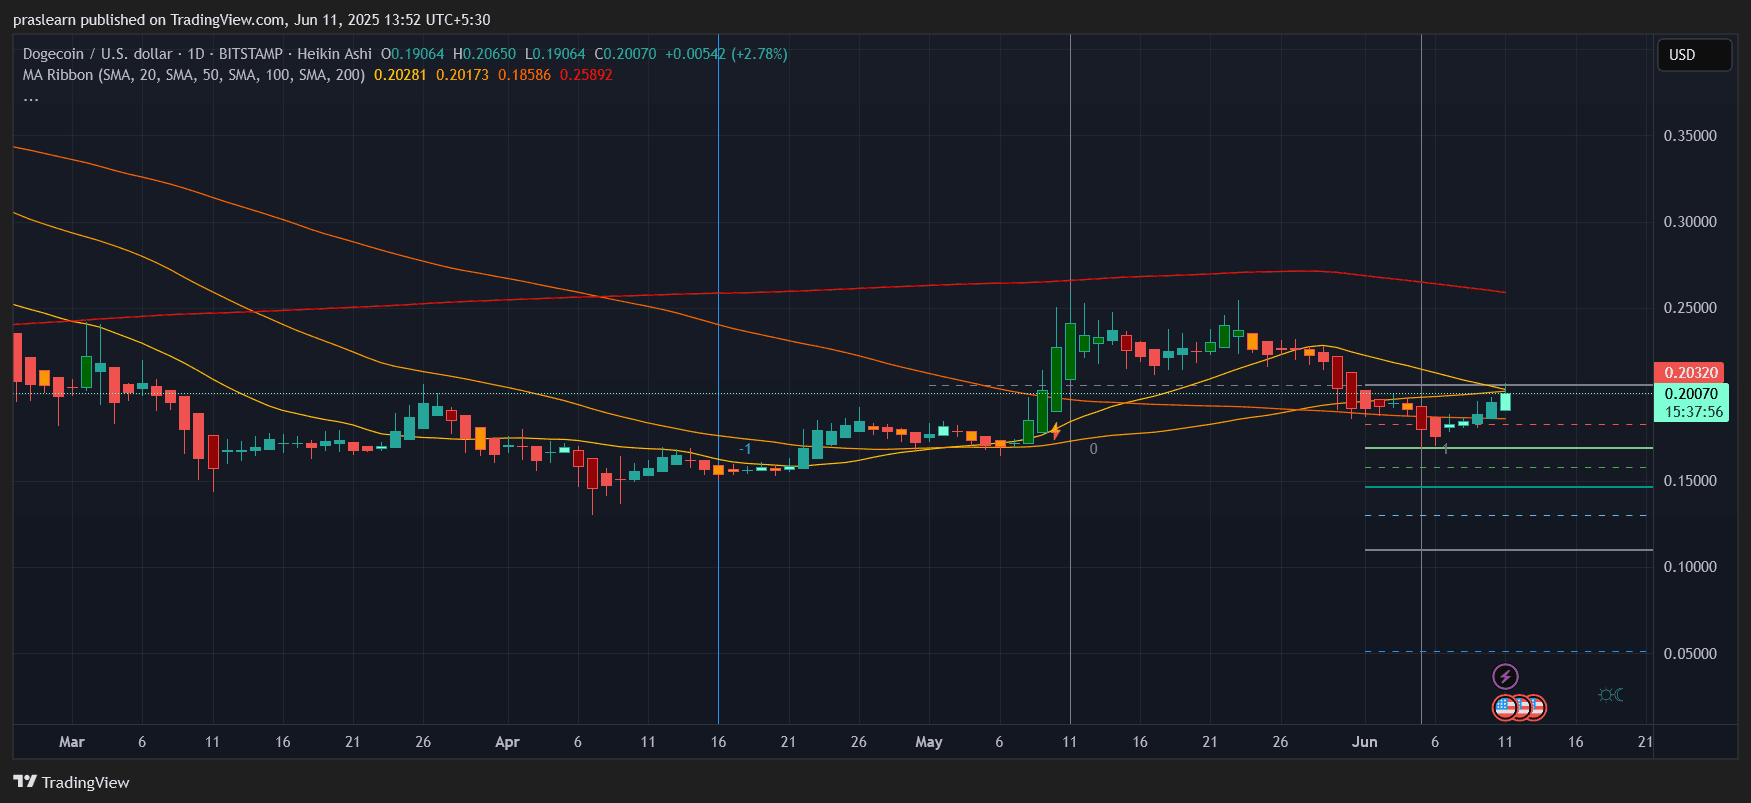 DOGE/USD 1 Day Chart- TradingView
The daily chart supports the bullish short-term momentum. DOGE price is up +2.78% today and reclaiming the 50-day SMA, which is currently around $0.2017. This is significant because the 50-day SMA has acted as dynamic resistance throughout the last few weeks.
Moreover, the Dogecoin price is forming a short-term double bottom with support near $0.16, and the neckline at $0.203 is being tested now. If DOGE manages to close a daily candle above this neckline, the classic double-bottom pattern targets approximately $0.25. The measured move is calculated as:
Target = Neckline + (Neckline – Bottom)
Target = $0.203 + ($0.203 – $0.16) = $0.203 + $0.043 = $0.246
That’s about a 22.5% upside from current levels.
Adding fuel to the fire, the 20-day SMA has turned up and crossed above the 100 SMA—a medium-term bullish crossover. The 200 SMA still sits higher at $0.2589, and that could act as the final upside target if momentum persists.
Dogecoin Price Prediction: Can DOGE Price Hit $0.26 in June?
Based on the hourly bullish structure and daily breakout confirmation, DOGE price looks poised to target $0.25–$0.26 over the next 7–10 days , provided Bitcoin holds above key support and market sentiment remains positive.
Assuming the breakout holds and volume increases, the following path looks realistic:
- Minor resistance at $0.21
- Bullish breakout to $0.23 (short-term Fibonacci extension)
- Final upside target $0.25–$0.26 (double bottom target + 200-day SMA)
From the current price of $0.203, a move to $0.26 would represent a 28% gain.
📊 Buy DOGE on Bitget
Final Take
Dogecoin price is showing strong bullish signals both on lower timeframes and the daily chart. The reclaim of $0.20 is not just a number—it breaks a psychological barrier, confirms a reversal structure, and brings in new technical buyers. With momentum building and key moving averages flipping, DOGE could be gearing up for a multi-week rally.
But as always, watch for a confirmed daily close above $0.21 and keep an eye on Bitcoin. If the broader market remains steady, Dogecoin may just surprise again—this time with a 30% run.
$DOGE, $Dogecoin
Dogecoin (DOGE) price has just crossed a critical psychological level of $0.20, and both the hourly and daily charts suggest this move might not be a fluke. The Dogecoin price appears to be breaking out from a consolidation phase , potentially setting itself up for a strong move toward the $0.26–$0.28 range in the coming days. Let’s dig into the charts to understand why this breakout could be just the beginning.
Dogecoin Price Prediction: What Does the Hourly Chart Reveal?
DOGE/USD 1 Hr Chart- TradingView
The 1-hour Heikin Ashi chart shows that DOGE price recently broke through local resistance at $0.20 with rising momentum. This level had acted as a ceiling for several days, and the breakout was supported by higher lows, forming an ascending triangle—one of the most bullish intraday setups.
The Moving Average (MA) Ribbon (20, 50, 100, 200 SMA) is now stacked in bullish order with the 20 SMA at $0.195 and the 200 SMA trailing lower at $0.187. This alignment confirms a near-term uptrend. The price is currently hovering around $0.203 with low selling pressure and strong Heikin Ashi green candles, hinting that bulls are firmly in control.
Also, Fibonacci retracement levels from the recent swing high around $0.21 to swing low near $0.18 show that DOGE has reclaimed the 0.618 golden zone and is now testing the 0.786 level, commonly a launchpad for accelerated moves.
If this breakout sustains, the next resistance lies for Dogecoin price around $0.21. A clean break above that could trigger a quick surge toward $0.23 and even $0.26.
📊 Buy DOGE on Bitget
Daily Chart Analysis: Bigger Picture Turning Bullish?
DOGE/USD 1 Day Chart- TradingView
The daily chart supports the bullish short-term momentum. DOGE price is up +2.78% today and reclaiming the 50-day SMA, which is currently around $0.2017. This is significant because the 50-day SMA has acted as dynamic resistance throughout the last few weeks.
Moreover, the Dogecoin price is forming a short-term double bottom with support near $0.16, and the neckline at $0.203 is being tested now. If DOGE manages to close a daily candle above this neckline, the classic double-bottom pattern targets approximately $0.25. The measured move is calculated as:
Target = Neckline + (Neckline – Bottom)
Target = $0.203 + ($0.203 – $0.16) = $0.203 + $0.043 = $0.246
That’s about a 22.5% upside from current levels.
Adding fuel to the fire, the 20-day SMA has turned up and crossed above the 100 SMA—a medium-term bullish crossover. The 200 SMA still sits higher at $0.2589, and that could act as the final upside target if momentum persists.
Dogecoin Price Prediction: Can DOGE Price Hit $0.26 in June?
Based on the hourly bullish structure and daily breakout confirmation, DOGE price looks poised to target $0.25–$0.26 over the next 7–10 days , provided Bitcoin holds above key support and market sentiment remains positive.
Assuming the breakout holds and volume increases, the following path looks realistic:
- Minor resistance at $0.21
- Bullish breakout to $0.23 (short-term Fibonacci extension)
- Final upside target $0.25–$0.26 (double bottom target + 200-day SMA)
From the current price of $0.203, a move to $0.26 would represent a 28% gain.
📊 Buy DOGE on Bitget
Final Take
Dogecoin price is showing strong bullish signals both on lower timeframes and the daily chart. The reclaim of $0.20 is not just a number—it breaks a psychological barrier, confirms a reversal structure, and brings in new technical buyers. With momentum building and key moving averages flipping, DOGE could be gearing up for a multi-week rally.
But as always, watch for a confirmed daily close above $0.21 and keep an eye on Bitcoin. If the broader market remains steady, Dogecoin may just surprise again—this time with a 30% run.
$DOGE, $Dogecoin
Disclaimer: The content of this article solely reflects the author's opinion and does not represent the platform in any capacity. This article is not intended to serve as a reference for making investment decisions.
You may also like
A whale sold 4,723 of the 14,945 ETH he accumulated nine years ago, worth $19.55 million.
![]() VIPBitget VIP Weekly Research Insights
VIPBitget VIP Weekly Research Insights
The cryptocurrency market has recently seen increased volatility, driven by macroeconomic policies, global trade tensions, and expectations the Federal Reserve's monetary policy. Although some indicators came in weak, investor sentiment improved as market expectations for a September rate cut rose sharply. Meanwhile, the slowdown in tariff adjustments has helped ease major trade frictions in the short term, with no signs of systemic risk emerging for the time being. On the crypto side, BTC turnover has fallen as many short-term traders exit the market, leading to more stable price movements. The altcoin sector continues to underperform due to a lack of sustained narratives. Despite the surge in memecoins, high-quality projects remain scarce. Large volumes of capital are cycling in and out quickly, making it difficult to invest effectively. With short-term uncertainty still high, many investors are allocating part of their portfolios to stablecoin-based Earn products. Alongside leading DeFi protocols such as Aave and Compound, platforms like Bitget offer diversified, high-yield stablecoin opportunities, providing investors with more avenues to preserve and grow their assets.

BONK Long Setup Builds as Supply Zone Flip Looms

Bullish Divergence Sets Stage for SHIB’s Potential 156% Surge