Date: Sat, June 07, 2025 | 10:21 AM GMT
The cryptocurrency market is bouncing back strongly after Thursday’s sharp sell-off, which briefly dragged Bitcoin (BTC) to a low of $100,430 and Ethereum (ETH) to $2,387. However, the tide has turned—BTC has reclaimed levels above $105,000, while ETH has recovered to around $2,487. This broader rebound is now lifting sentiment across altcoins , including Artificial Superintelligence Alliance (FET).
FET is back in the green today with fresh gains, and a closer analysis of the charts suggests that a bullish continuation may be brewing.
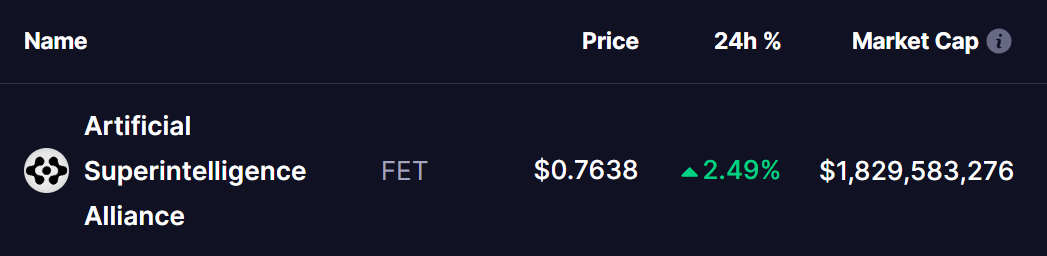 Source: Coinmarketcap
Double Bottom Pattern Signaling an Upside Move
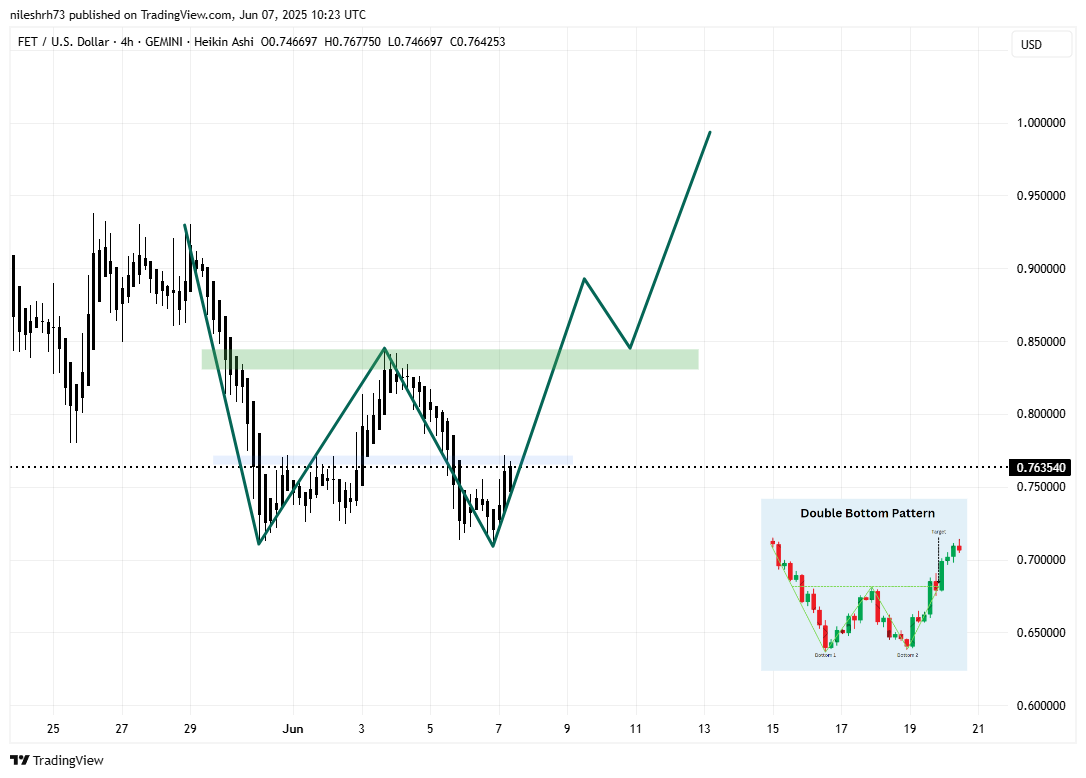
The 4-hour chart shows a textbook Double Bottom pattern forming—one of the most reliable bullish reversal signals in technical analysis.
The pattern began on May 31, with FET dipping to $0.71 to form the first bottom. This was followed by a bounce toward the $0.8460 neckline (highlighted in green), where it faced rejection on June 3.
 FET 4H Chart/Coinsprobe (Source: Tradingview)
The price then retraced to $0.71 again on June 6, completing the second bottom—indicating strong buying interest at that level.
From there, FET staged a quick recovery, now trading around $0.76, just below the blue resistance ($.77) and the neckline zone. This recovery leg is crucial as it lays the foundation for a potential breakout.
What’s Next for FET?
If FET successfully breaks above the $0.77 resistance and then the $0.8460 neckline, it would confirm the double bottom pattern. A clean breakout—especially one supported by volume and possibly a retest of the neckline—could set the stage for a rally towards the technical target of around $0.98.
That target is drawn from the height of the double bottom structure projected from the breakout point. From current levels, this move could offer a gain of nearly 30%, making FET one of the more exciting setups in the short term.
Disclaimer: This article is for informational purposes only and not financial advice. Always conduct your own research before investing in cryptocurrencies.