

- Bitcoin dropped 10.2% following a golden cross, reversing gains built in late May.
- BTC currently trades at $103,180, staying narrowly above its key support at $100,783.
- Unlike past golden crosses, this one triggered a pullback instead of a rally.
Bitcoin’s recent price behavior has drawn attention following a 10.20% decline from its local peak, which came shortly after the formation of a golden cross. At the end of May, the chart pattern commonly seen as bullish occurred when the 50-day moving average went above the 200-day moving average.
Even with that sign, BTC is now trading at $103,180, dropping 1.1% in the past 24 hours. The sudden downturn has raised questions about the pattern’s short-term impact and the strength of current market support levels.
Golden Cross Followed by Unexpected Pullback
Although golden crosses historically hint at upward momentum, Bitcoin moved against the trend this time. The asset declined by over 10% shortly after the crossover, erasing gains built over several weeks. This drop retraced the advance from the May low of $92,295 to its early June high above $102,900. The sharp reversal undermined immediate bullish sentiment and introduced near-term uncertainty into the market.
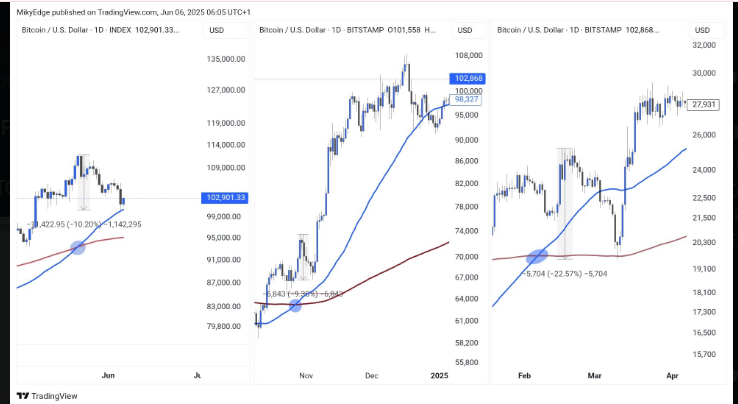 Source: (X)
During similar technical conditions in November and February, BTC registered double-digit rallies following golden crosses. However, in the current scenario, the price has fallen despite forming the same structure. This deviation from prior outcomes has led market analysts to adopt a cautious stance, with many watching Bitcoin’s key support zone near $100,783.
Market Holds Above Critical Support Level
At press time, Bitcoin trades narrowly above the $100,783 support. This has been an area of focus for analysts and traders alike, especially with the price lacking footing following its recent 10% decline. An extended break below the level could be an indication of broader weakness, while holding above the level could provide bulls with a chance to regain strength.
The 24-hour price range remains tight, fluctuating between $100,783 and $105,888. After a time of uncertainty in late May and early June, with whales making large trades, the market has now calmed down significantly. While the recent downturn is evident, the overall long-term trend is still valid, as prior chart rallies support it.
Historical Patterns Show Mixed Reactions
Looking at past cycles, Bitcoin has shown mixed reactions to golden cross formations. In late 2024, the same pattern preceded a strong rally that pushed prices above $100,000 for the first time. A similar setup in early 2025 also resulted in notable gains. However, the current 10% pullback breaks from that behavior, suggesting a possible shift in market dynamics.
As price remains above $100K, traders are closely monitoring for either a breakdown or potential reversal. Chart patterns and support levels are likely to remain key drivers in the days ahead.