

- Bitcoin tests $112K resistance after steady rise but momentum shows signs of slowing down in daily trading.
- The price holds above a key ascending trendline which has supported Bitcoin since mid-April but risks breaking soon.
- If Bitcoin drops below $100K support it could trigger more selling and increased market volatility in the short term.
Bitcoin (BTC) continues to encounter resistance at a crucial level marked on recent charts. Price action indicates a weakening momentum on the daily timeframe. The cryptocurrency is trading near $109,000 but struggles to break past a strong resistance trendline. Analysts note that a breakdown below the current ascending trendline could result in Bitcoin falling back under the $100,000 mark. This technical situation raises questions about Bitcoin’s near-term price direction amid ongoing market fluctuations.
 Source: X
Resistance Zone and Price Action Analysis
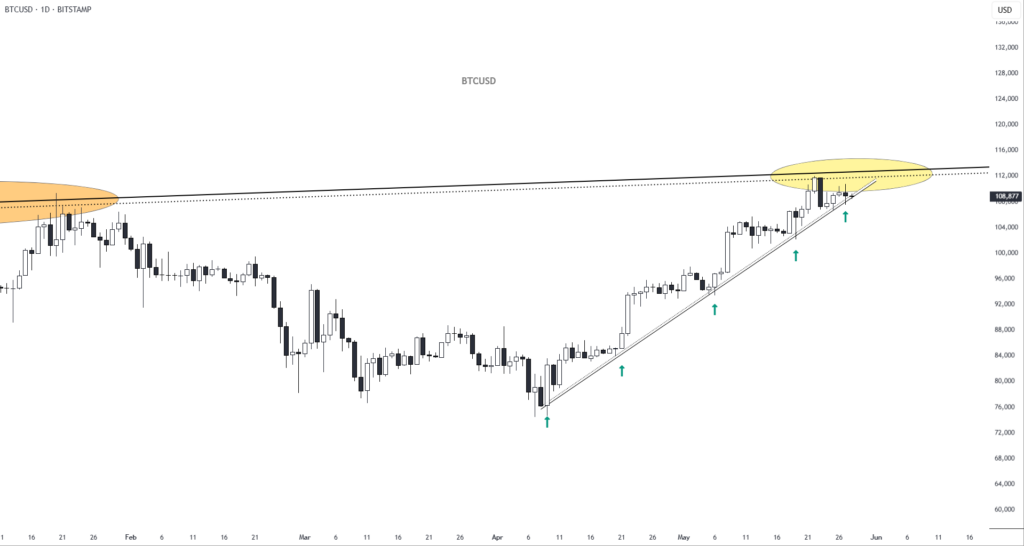
Bitcoin’s price has repeatedly tested a significant resistance zone highlighted on the chart. This zone connects two peaks from recent price action, suggesting a long-term resistance that Bitcoin has not yet surpassed. The current resistance level stands near $112,000, which remains a challenging barrier. Price candles show multiple attempts to break through, but sellers appear to dominate at this level.
The chart shows an ascending trendline supporting Bitcoin’s price since mid-April. This trendline has held strong, with several price bounces marked by green arrows. The consistent support indicates some bullish sentiment in the medium term. However, the repeated rejection at the resistance level indicates potential exhaustion of buying pressure. Traders closely watch these levels for signs of either a breakout or a breakdown .
Momentum on the daily timeframe is showing signs of weakening. The upward trend has slowed, suggesting the possibility of consolidation or a pullback. If Bitcoin fails to maintain the current trendline support, a correction toward $100,000 or lower could materialize. This scenario would represent a shift from recent bullish momentum and may influence market sentiment.
Technical Implications of a Breakdown Below Trendline
If Bitcoin breaks below the ascending trendline, technical analysts warn it may trigger further selling pressure. The breakdown could open the door for price retracement to previous support levels. A move below $100,000 would mark a significant setback from recent gains and may impact market confidence. Such a correction might attract short-term sellers while testing the resilience of long-term holders.
The trendline acts as a key reference point for many traders who use it to gauge market strength. Failure to hold this line could indicate a loss of momentum and a potential change in trend. Moreover, breaking this support could lead to increased volatility as market participants adjust positions. This scenario emphasizes the importance of closely monitoring Bitcoin’s price behavior in the coming days.
The current price action suggests cautious optimism amid uncertainty. While the ascending trendline supports price, the resistance zone near $112,000 has proven difficult to overcome. The tension between buyers and sellers at these levels sets the stage for a critical market move. Observers remain attentive to whether Bitcoin can reclaim bullish momentum or if a downturn is imminent.
Market Sentiment Versus Technical Reality
Market sentiment appears optimistic based on broader news and developments in the crypto sector. However, the chart tells a more cautious story. The resistance and trendline dynamics imply a struggle between bullish expectations and technical constraints. This divergence between sentiment and price action raises a pivotal question: can Bitcoin sustain its upward trajectory amid strong resistance?
Despite positive market narratives, the technical chart highlights the need for caution. The resistance zone serves as a barrier that Bitcoin has historically struggled to surpass. Meanwhile, the ascending trendline provides temporary support, but its breach could alter market outlook drastically. Traders and investors are likely weighing these factors as they position themselves in the market.