

After failing to extend its breakout above $110,400, the Bitcoin price today is consolidating near $108,800 as short-term momentum slows. The broader Bitcoin price action has remained range-bound since the May 21 peak near $111,889, with technical indicators now signaling caution. With the daily trend still positive, but lower timeframes showing weakness, investors are asking: why is Bitcoin price going down today despite a strong macro backdrop?
What’s Happening With Bitcoin’s Price?
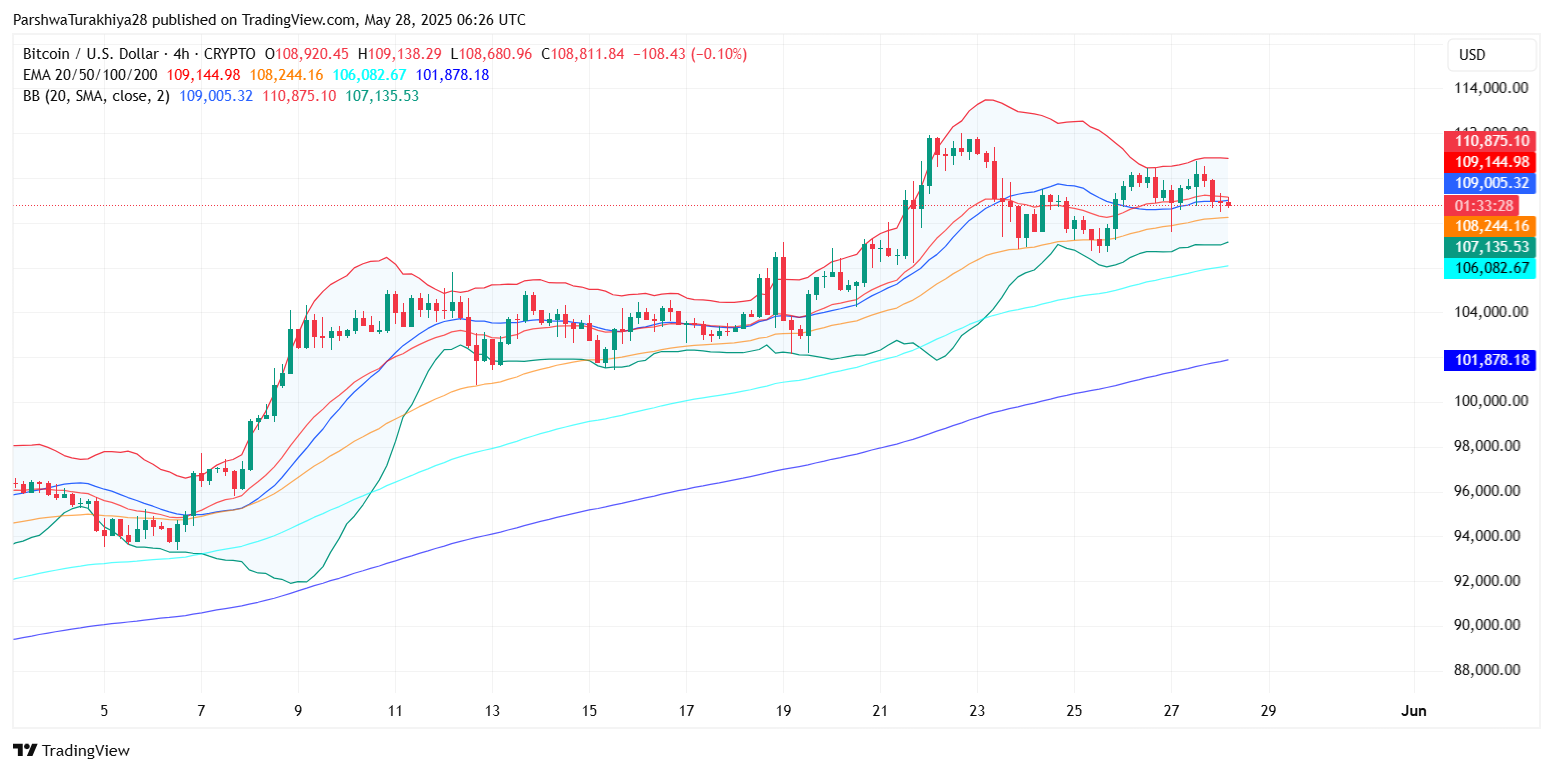
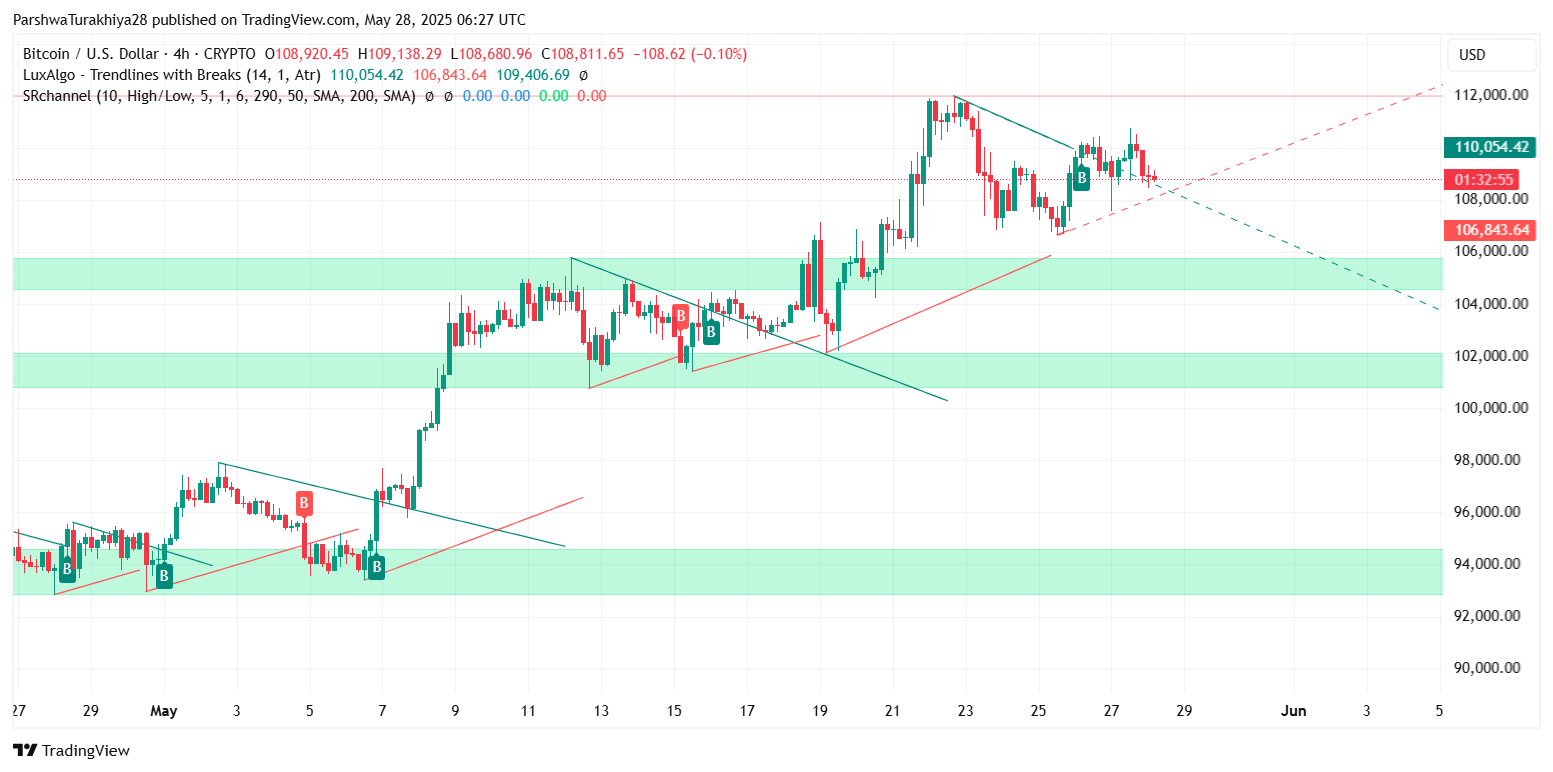
On the 4-hour chart, Bitcoin price remains in a tightening structure between $108,200 and $110,400. The recent drop from the upper bound has pushed BTC back below the 20 and 50 EMA lines ($109,144 and $108,244), while the price now flirts with Bollinger Band midlines and support clusters near $108,500.
From a pattern perspective, the structure resembles a rising wedge breakdown or a rounded top, especially after repeated failures to breach the $110,400–$110,800 supply zone. Volatility, as indicated by the Bollinger Bands on both 30-minute and 4-hour charts, has compressed considerably—suggesting a high-probability breakout or breakdown in the next 24–48 hours.
Why Bitcoin Price Going Down Today? Rising Bearish Divergences Trigger Weakness
 BTC price analysis (Source: TradingView)
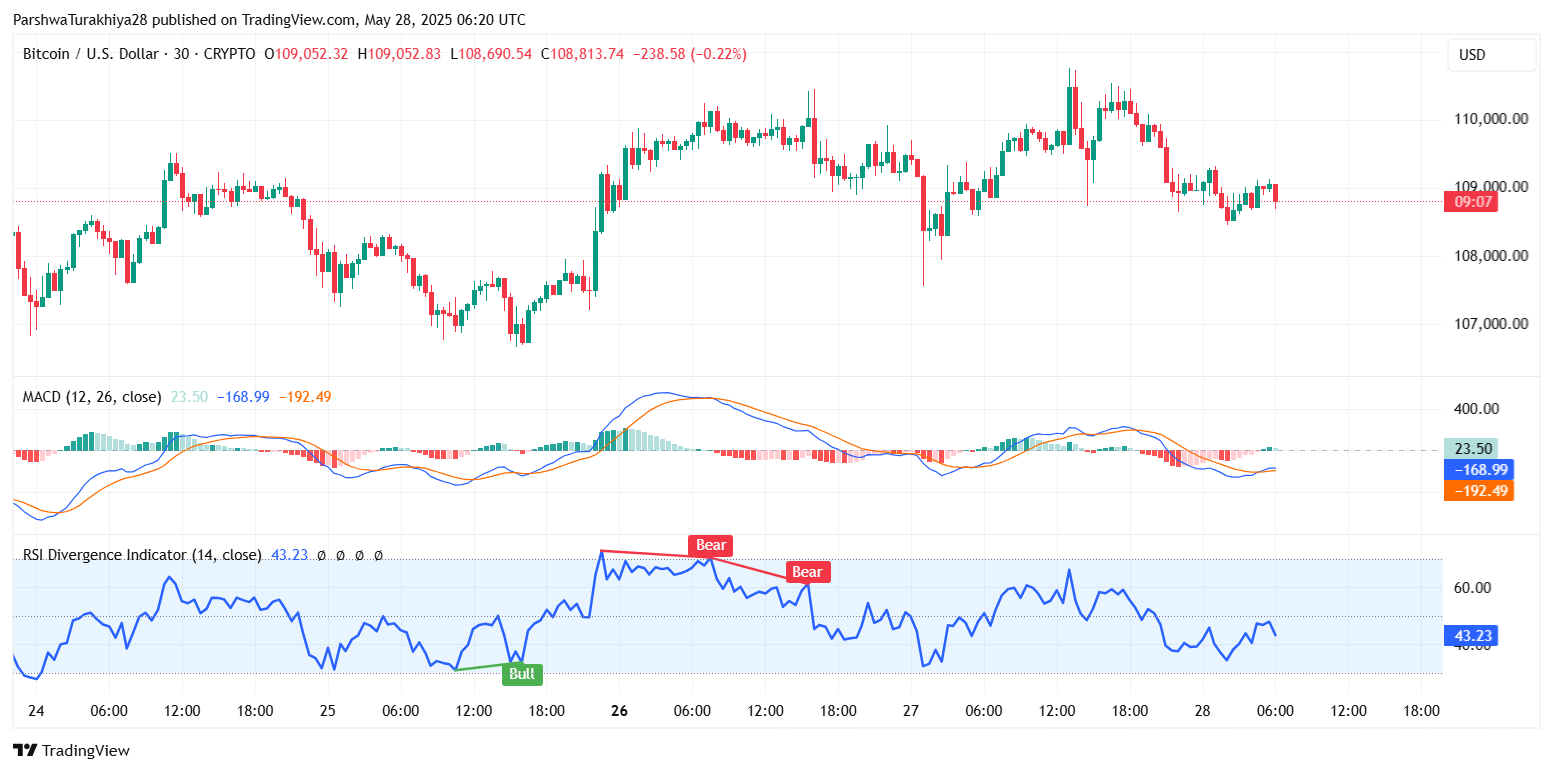
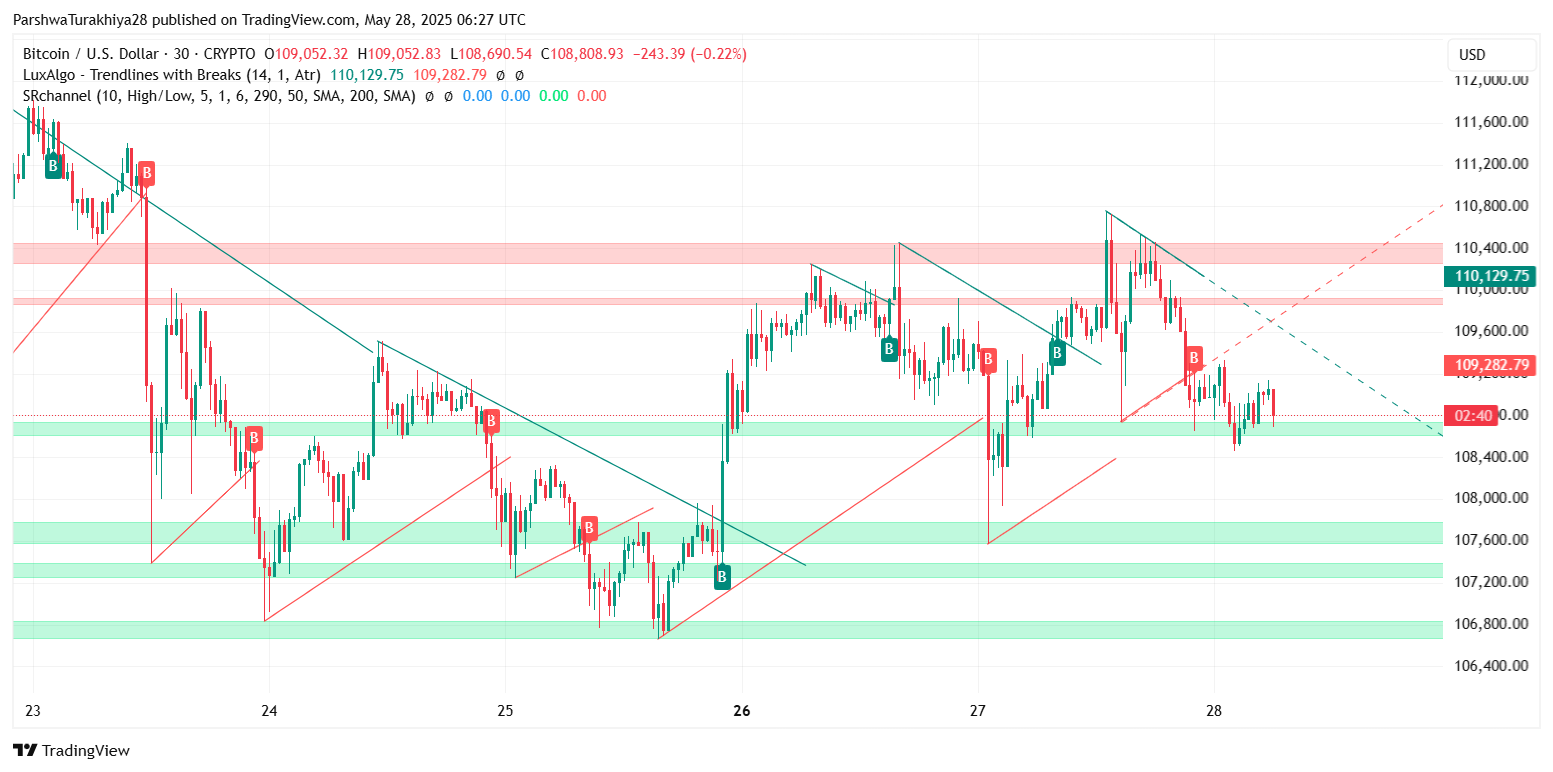
The main reason why Bitcoin price going down today lies in the clear divergence across momentum indicators. On the 30-minute chart, multiple bearish divergences were observed on the RSI as price tried to push above $110K—each push was weaker than the last. Additionally, MACD lines on the same timeframe have crossed below the signal line with a bearish histogram expansion, confirming the waning bullish strength.
 BTC price analysis (Source: TradingView)
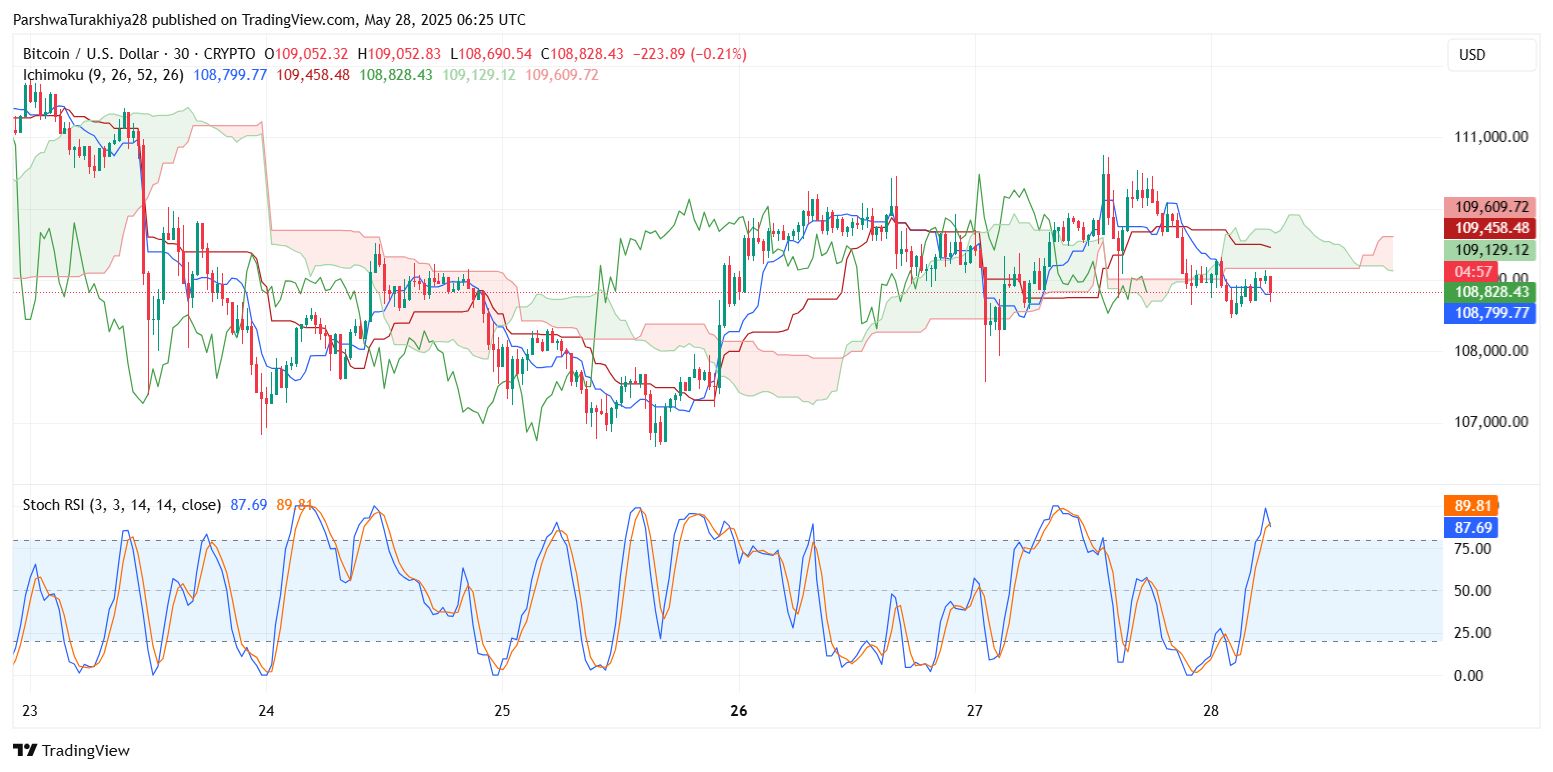
The Ichimoku Cloud shows price breaking below the cloud support near $109,000 on the 30-minute chart, with the Tenkan-sen and Kijun-sen lines now crossing bearishly. The Chikou span also trails behind price, adding to the bearish short-term outlook.
 BTC price analysis (Source: TradingView)
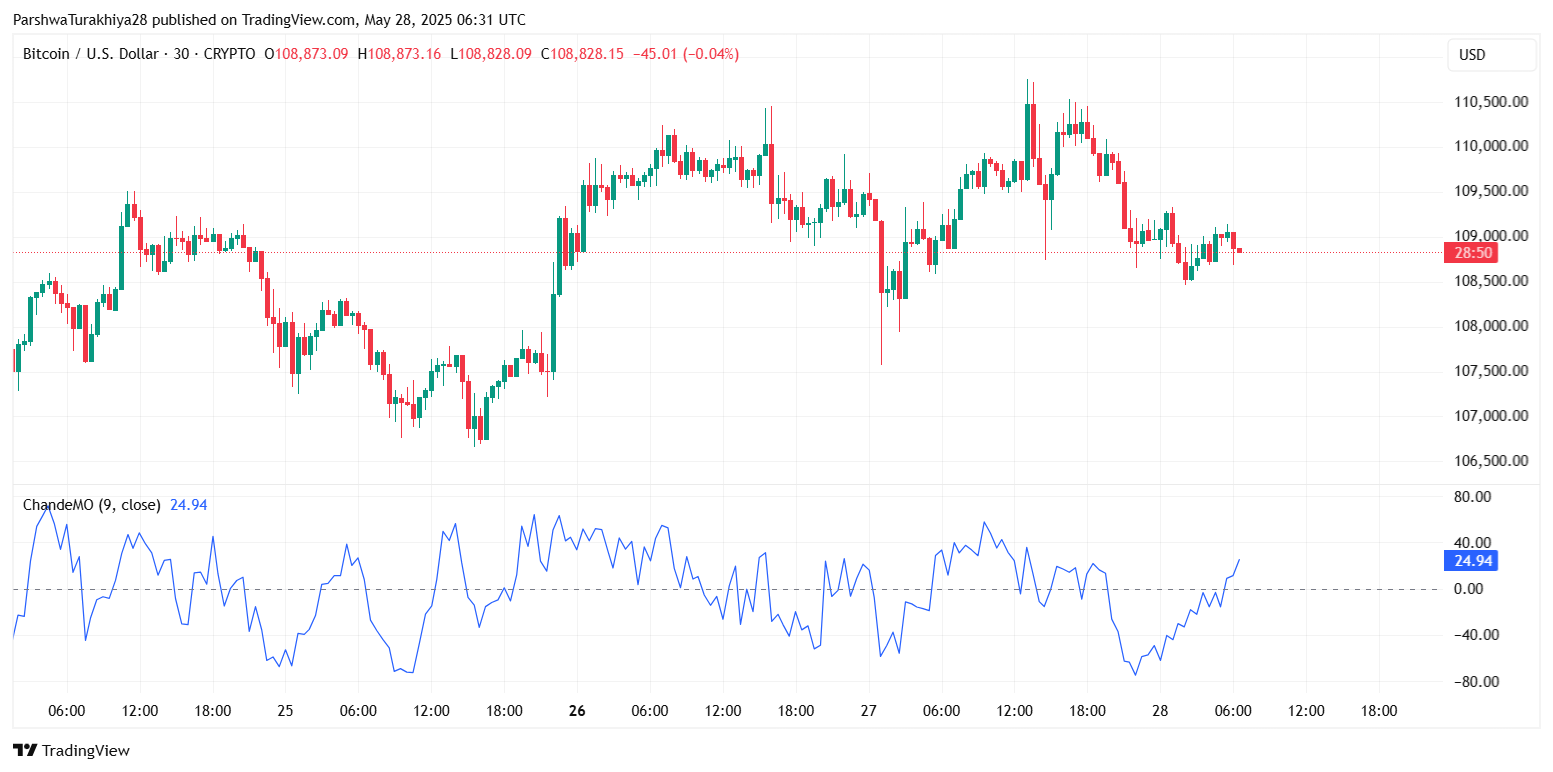
Stoch RSI is also flashing overbought rejections above 85, while the Bitcoin price update shows Chande Momentum Oscillator turning down after peaking near 25. This cluster of weakening signals reflects exhaustion in upside momentum after last week’s aggressive breakout.
Bitcoin Price Update: Key Support Zones To Watch Into May 29
 BTC price analysis (Source: TradingView)
The immediate Bitcoin price update puts the spotlight on $108,200 as the nearest make-or-break zone. This level has acted as soft support since May 26 and aligns with the bottom of the current wedge structure. If price breaks decisively below this level, further downside toward $106,800 and $104,000 becomes likely, based on previous supply-demand flips and Fibonacci confluences.
 BTC price analysis (Source: TradingView)
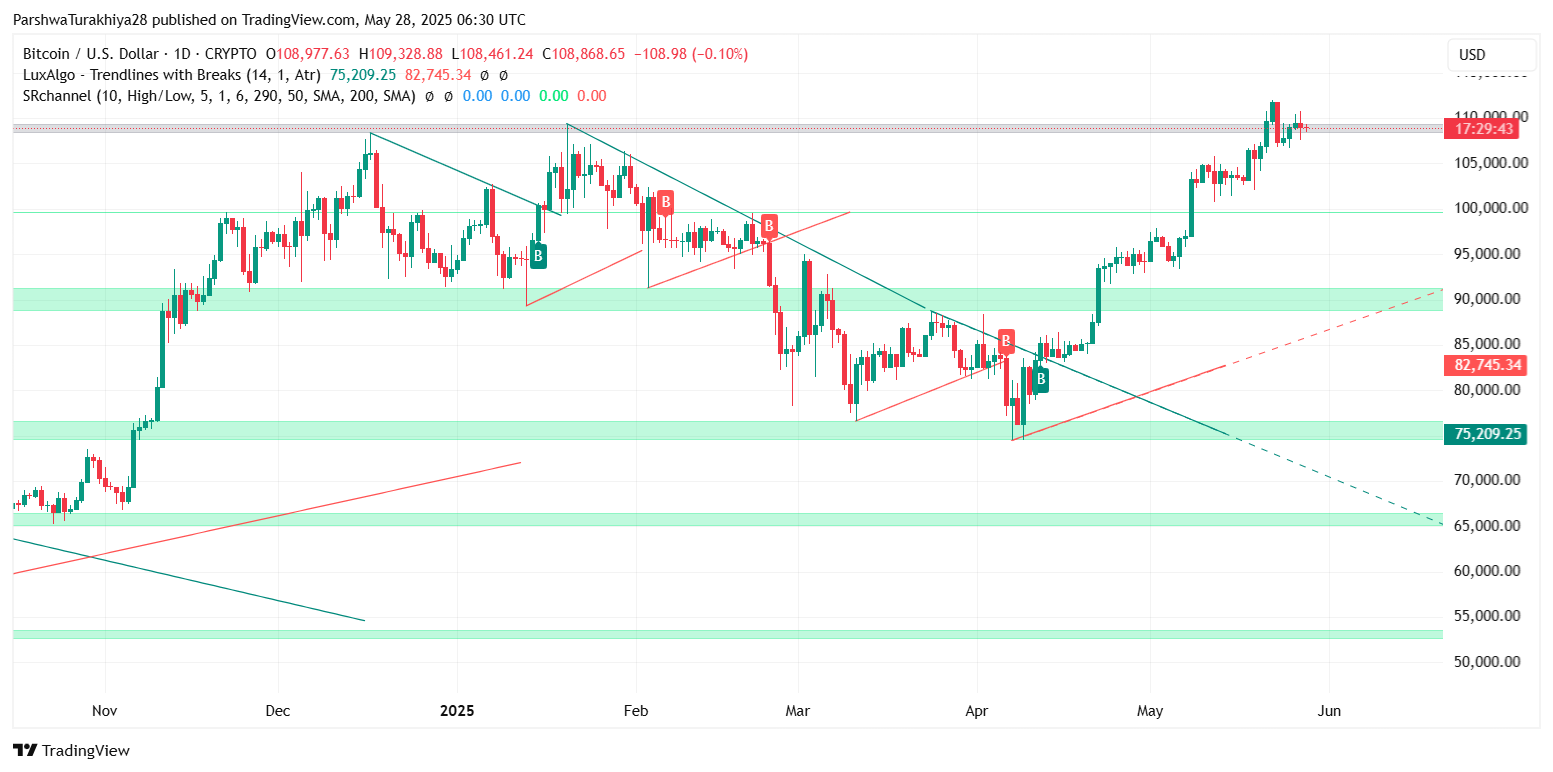
On the daily chart, BTC is still holding above the 100 and 200 EMA bands at $106,082 and $101,878 respectively, which should offer mid-term support if volatility expands sharply downward. However, a failure to reclaim $109,600–$110,000 by May 29 could accelerate the correction.
Bitcoin Price Forecast for May 29: Range Breakout or Breakdown on Deck
 BTC price analysis (Source: TradingView)
As of now, Bitcoin price volatility is near a short-term inflection point. The price has failed to sustain higher highs since May 23, despite multiple bullish triggers. Unless bulls reclaim $109,600 with strength and volume, the bias remains tilted to the downside with $106,800 and $104,000 in focus.
On the flip side, a successful flip of $110,400 could trigger a renewed rally toward $111,800 and potentially $113,200 based on wedge breakout targets. However, this would require a breakout from the current descending channel visible on the 30-minute chart.
The RSI Divergence Indicator continues to show pressure building for a directional move. Traders should monitor MACD crossovers, Bollinger Band expansion, and the Ichimoku cloud edge near $109,200 for early cues into the move.
BTC Forecast Table for May 29
| Indicator / Zone | Level (USD) | Signal |
| Immediate Support | 108,200 | Key lower trendline and intraday demand |
| Secondary Support | 106,800 | Breakdown target below wedge |
| Major Resistance | 110,400 | Repeated intraday rejection zone |
| Next Resistance | 111,800 | Previous high and supply block |
| RSI (30-min) | 43.23 | Bearish divergence, below neutral |
| MACD (30-min) | Bearish crossover | Momentum turning negative |
| Bollinger Band Width (4H) | Tight | Volatility compression near end phase |
| Ichimoku Cloud (30-min) | Bearish | Price below cloud with weak support |
| Stoch RSI (30-min) | 87.69–89.81 | Overbought, turning down |
| Chande Momentum (30-min) | 24.94 | Weak recovery after recent peak |
The Bitcoin price today is hovering at a pivotal zone, with bulls fighting to keep the structure intact above $108,200. However, momentum indicators are weakening, and multiple rejection wicks near $110,400 suggest short-term exhaustion. Unless buyers step in soon with conviction, Bitcoin price action may tilt into a sharper correction before attempting a new leg higher.
Disclaimer: The information presented in this article is for informational and educational purposes only. The article does not constitute financial advice or advice of any kind. Coin Edition is not responsible for any losses incurred as a result of the utilization of content, products, or services mentioned. Readers are advised to exercise caution before taking any action related to the company.