

SUI price today is hovering near $3.72, showing signs of renewed momentum as bulls attempt to reclaim control following a recent pullback from May’s local highs. After bouncing from a key support band near $3.50, the SUI price action has staged a moderate recovery, but still faces a key challenge at the $3.75–$3.80 resistance confluence.
The charts show an early attempt at a breakout, with bulls defending the 100-EMA zone while short-term indicators signal mixed sentiment. Can the rally extend higher, or is another rejection likely?
What’s Happening With SUI’s Price?
 SUIUSD price dynamics (Source: TradingView)
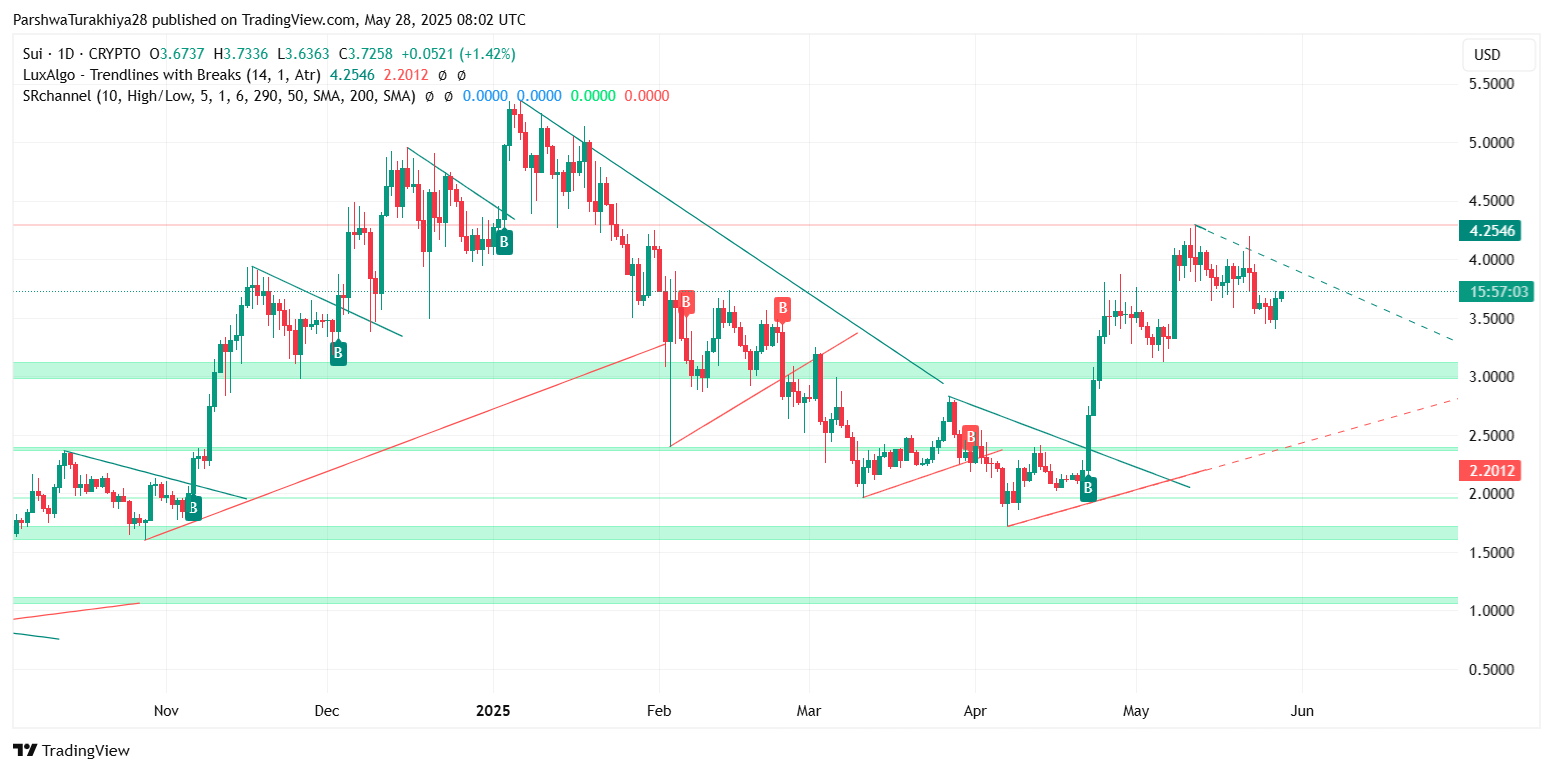
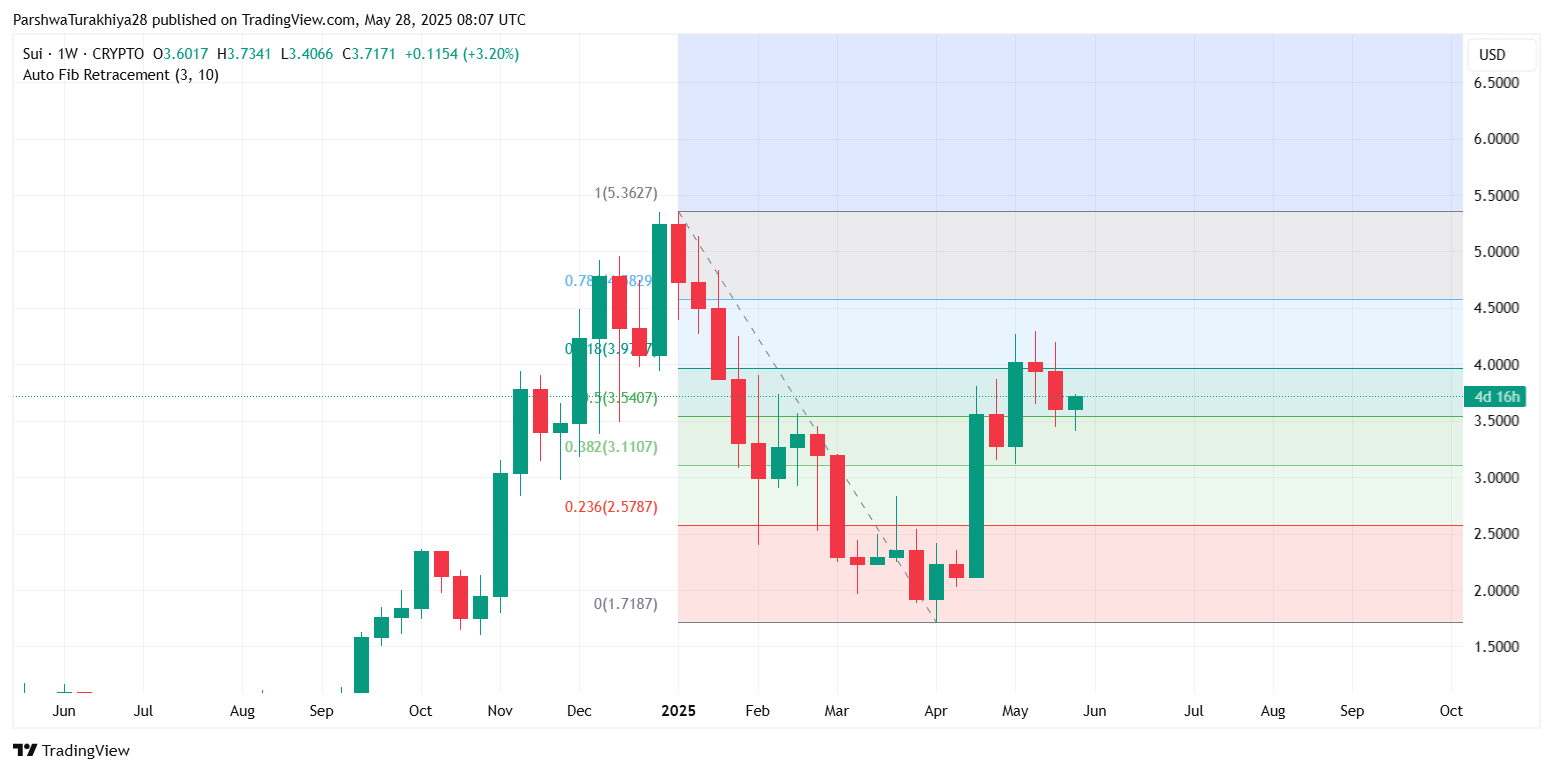
The SUI price today is up over 3% in the last 24 hours, now testing a lower high structure after bouncing off the $3.50 region. On the daily chart, price remains within a broader descending wedge pattern that began forming after the April highs near $5.36. Despite recent volatility, the token has consistently formed higher lows since the mid-April reversal, with support holding near the rising trendline from the $1.71 low.
 SUIUSD price dynamics (Source: TradingView)
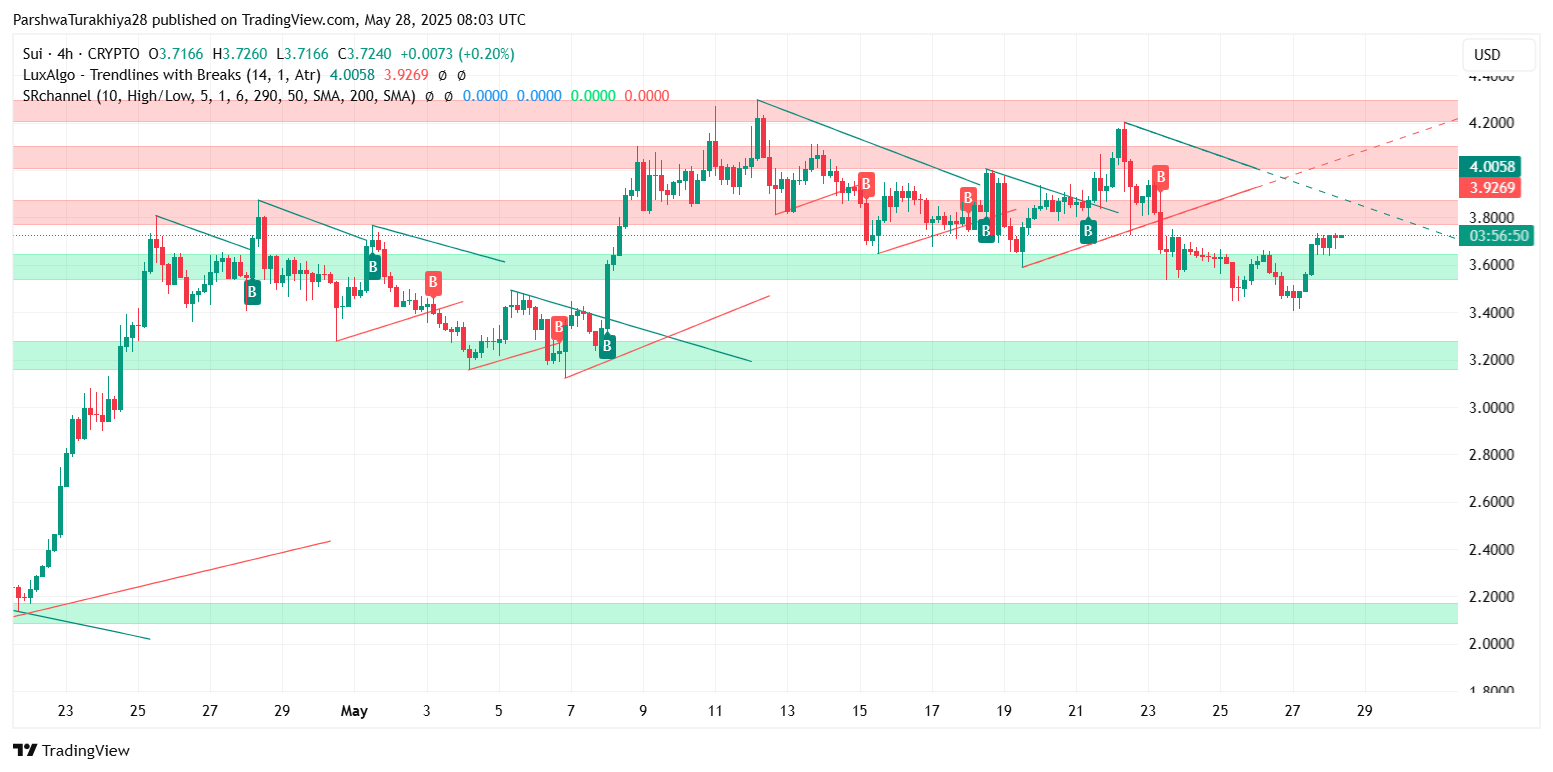
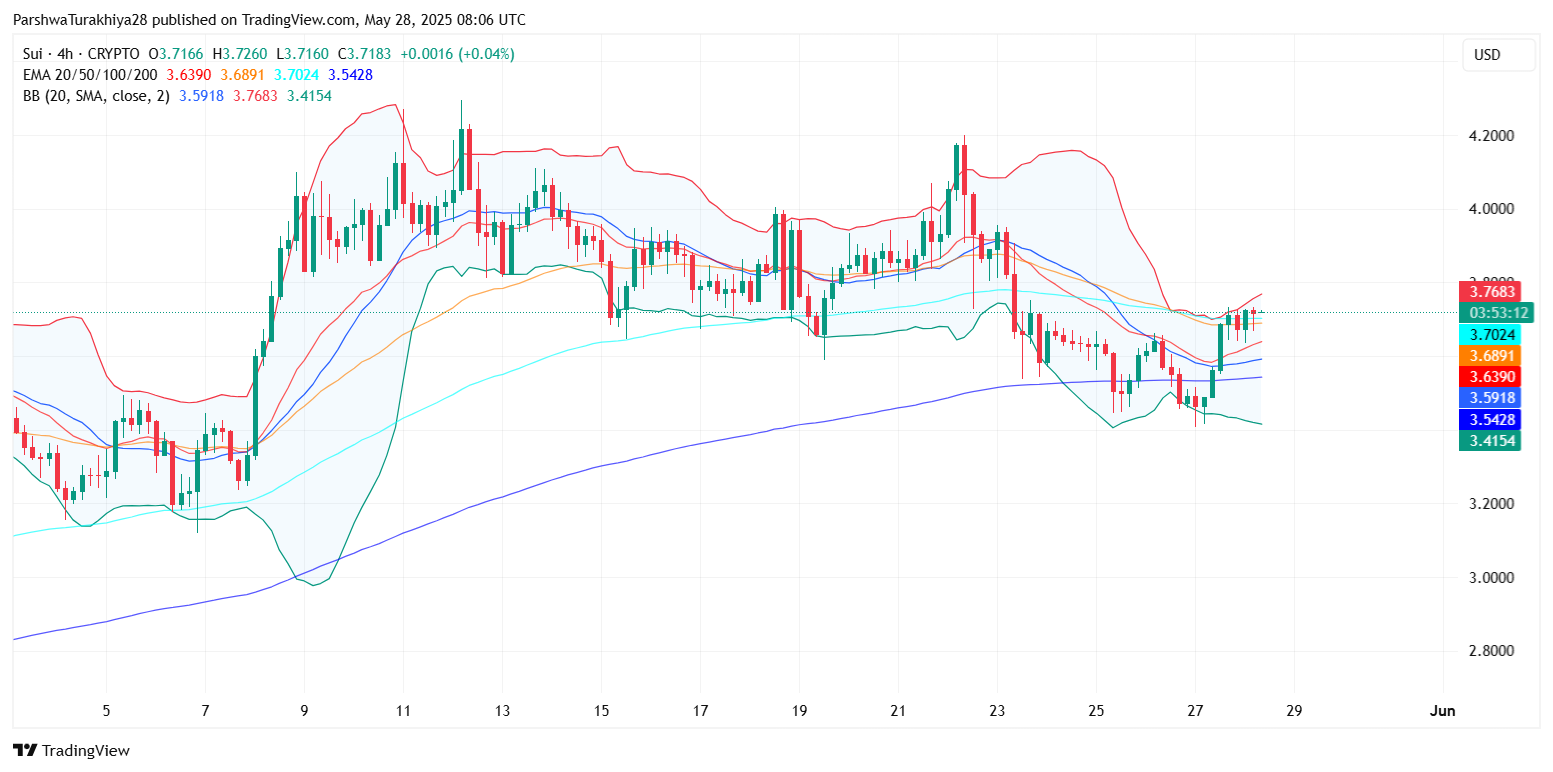
On the 4-hour chart, SUI is attempting a re-entry into the $3.75 resistance band, which aligns with multiple failed breakout points from earlier this month. The price remains capped under a declining trendline from the May 21 peak, and momentum indicators show modest bullish divergence.
RSI, MACD, and Momentum Indicators Signal Uncertainty
 SUIUSD price dynamics (Source: TradingView)
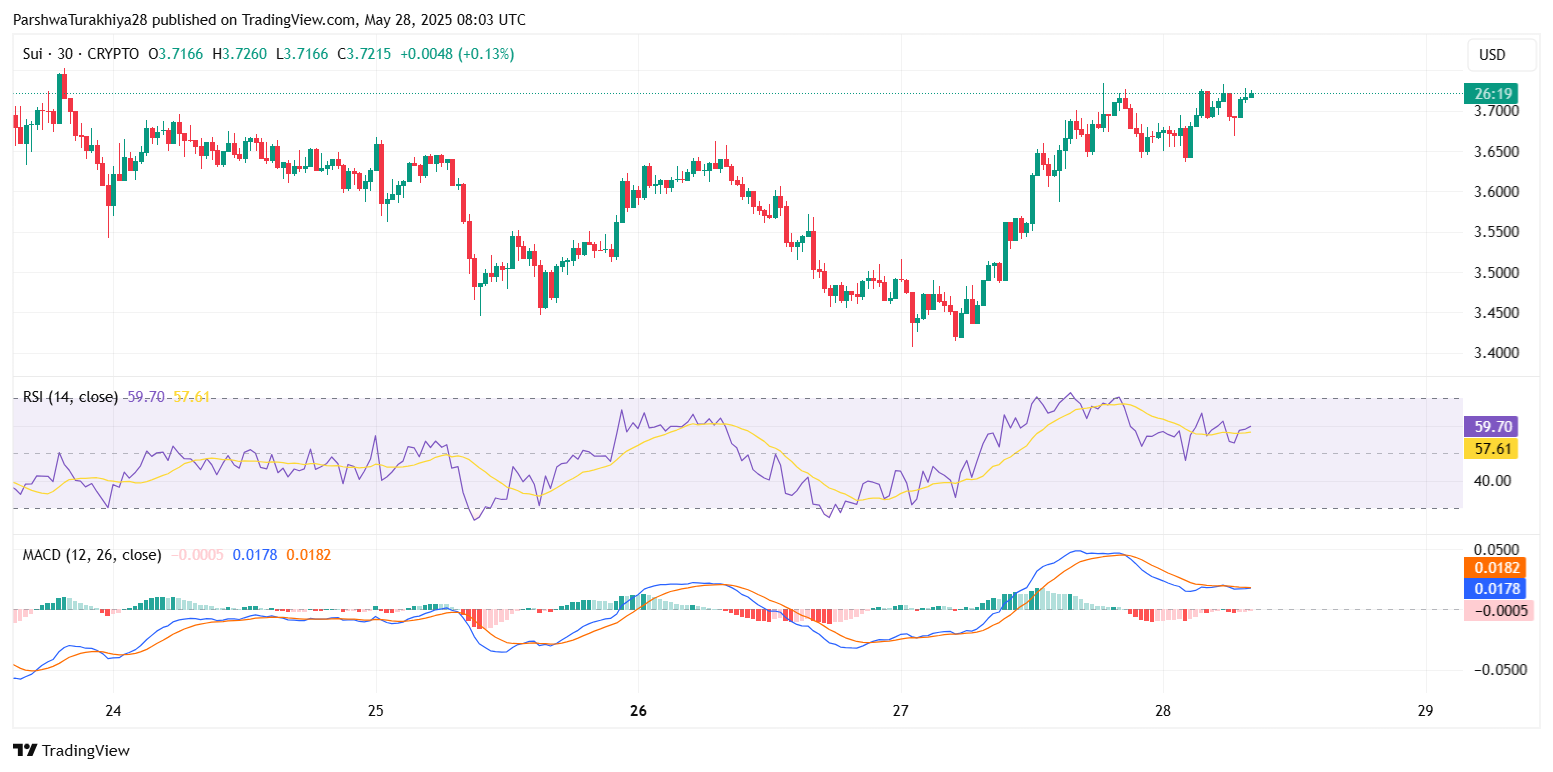
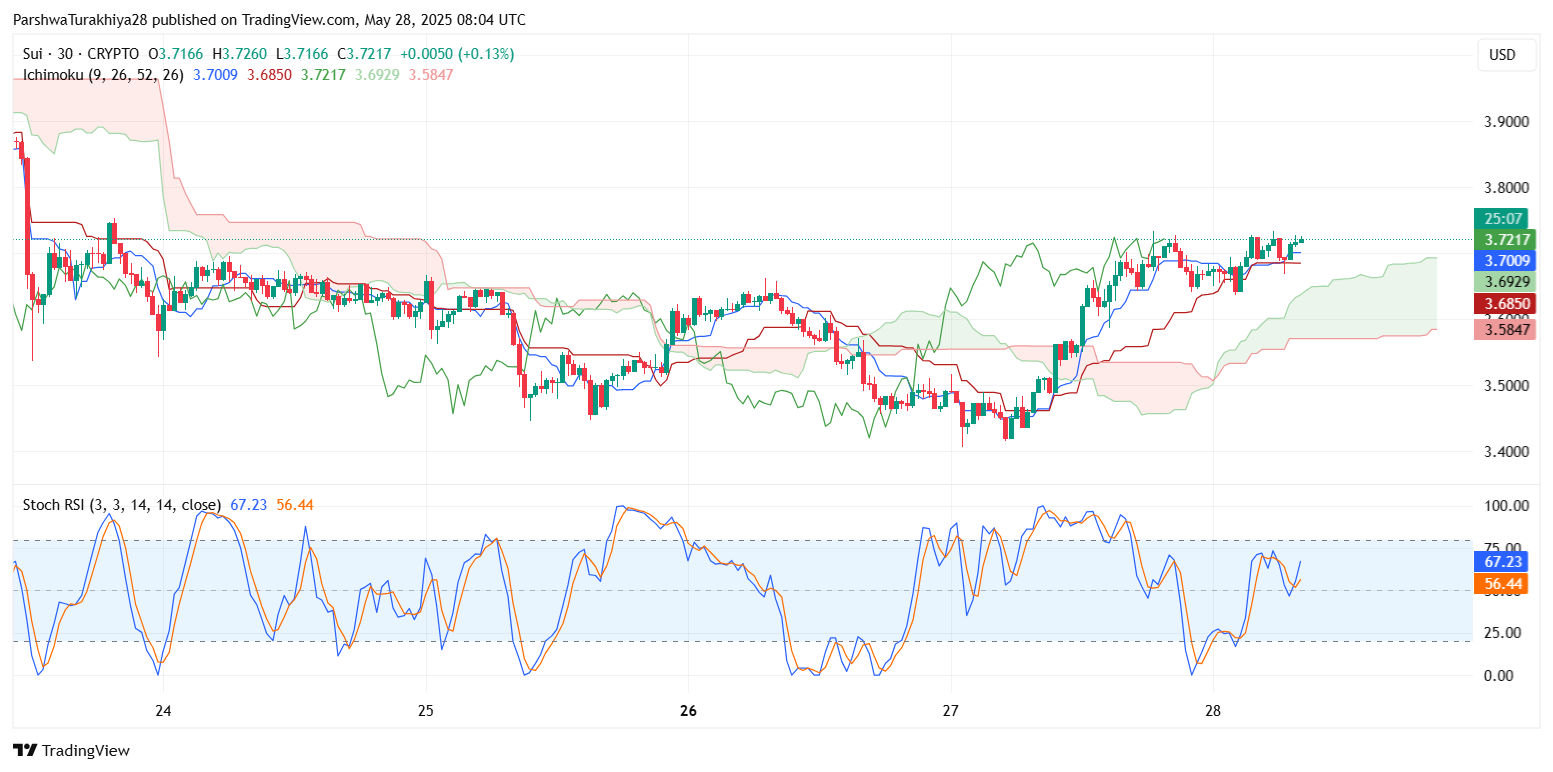
Technical indicators provide a mixed read. On the 30-minute and 4-hour RSI, values hover around 57–59, indicating mild bullishness without entering overbought territory. However, on the daily time frame, RSI remains neutral just above the 50 mark, suggesting there’s room for an upside push if momentum strengthens.
The MACD histogram has flipped slightly positive on the 30-minute chart, with a weak bullish crossover visible. However, the slope remains flat, showing that buyers are not yet in full control.
 SUIUSD price dynamics (Source: TradingView)
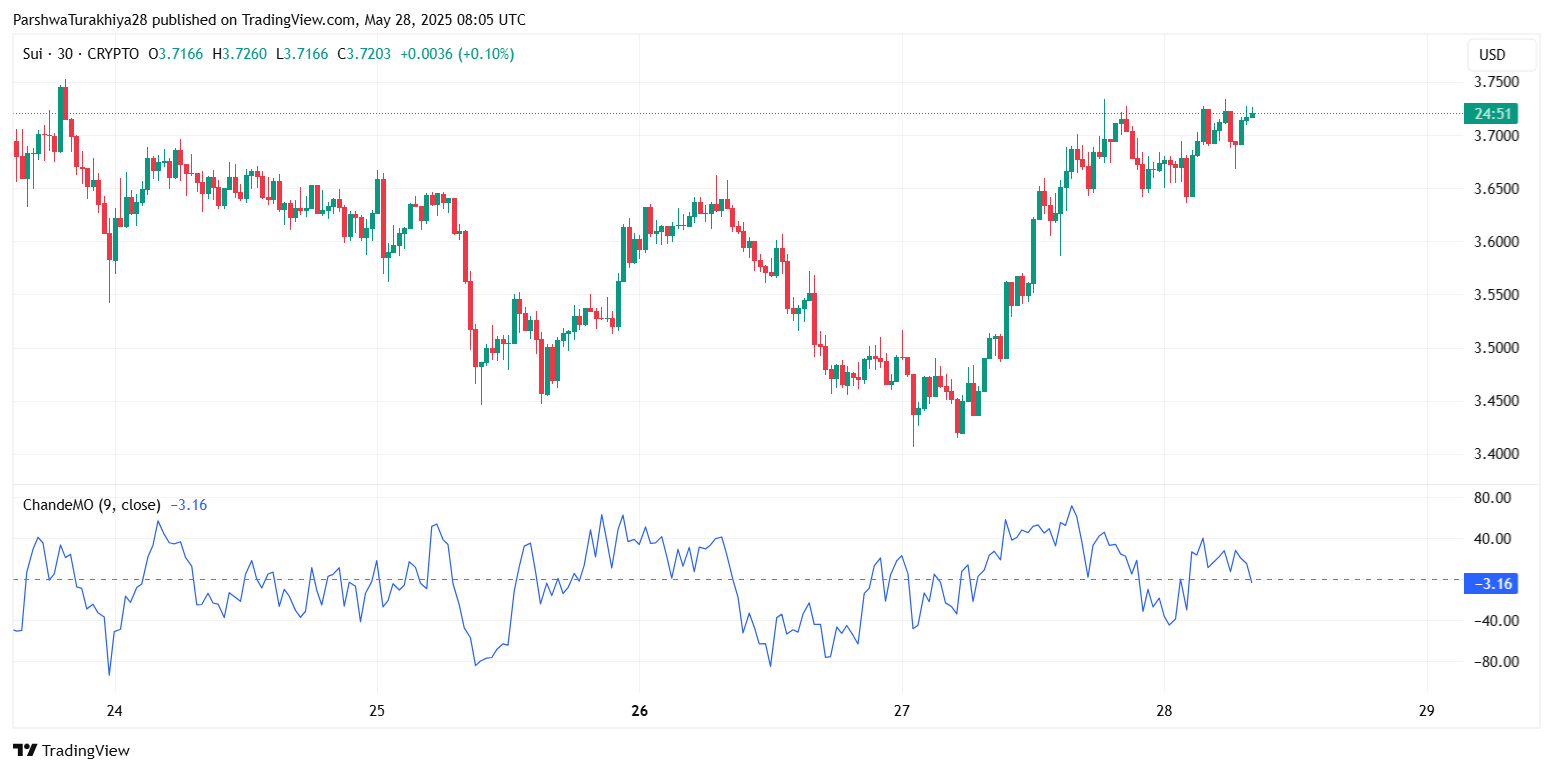
Meanwhile, the Chande Momentum Oscillator (ChandeMO) is barely above zero, reflecting choppy price movement rather than a confirmed trend. Similarly, the Stoch RSI on the 30-minute chart is climbing toward overbought levels, hinting that short-term profit-taking could emerge unless there’s a strong volume breakout.
Bollinger Bands and Ichimoku Cloud Suggest Breakout Attempt
 SUIUSD price dynamics (Source: TradingView)
The Bollinger Bands on the 4-hour chart have begun to widen again after a tight squeeze on May 26–27. The SUI price is now riding the upper band, attempting to confirm a bullish extension toward the $3.90–$4.00 level. A clean break above $3.76 with volume confirmation could open the path toward $4.00 and potentially $4.25.
 SUIUSD price dynamics (Source: TradingView)
The Ichimoku Cloud on the 30-minute chart is mildly bullish. Price is trading above the conversion line (Tenkan-sen) and the baseline (Kijun-sen), while the cloud itself is relatively thin, suggesting a potential weak trend continuation. If bulls sustain the momentum, the next resistance zone at $3.92 becomes critical.
Why SUI Price Going Up Today?
 SUIUSD price dynamics (Source: TradingView)
The question is: Why SUI price going up today? The answer lies in a combination of chart structure, support zone resilience, and minor bullish divergences across momentum indicators:
- Price is holding well above the key support at $3.50 and bounced sharply after defending the 100-EMA.
- A descending wedge breakout attempt is underway with mild bullish confirmation on lower time frames.
- RSI and MACD indicators are beginning to favor buyers, albeit with low volume so far.
- Broader altcoin sentiment has also stabilized, contributing to a risk-on mood.
Unless rejected sharply from the $3.75 zone, this could mark the start of a fresh leg toward $3.92 and potentially the 0.618 Fibonacci retracement at $3.97.
Short-Term Outlook and Technical Forecast
 SUIUSD price dynamics (Source: TradingView)
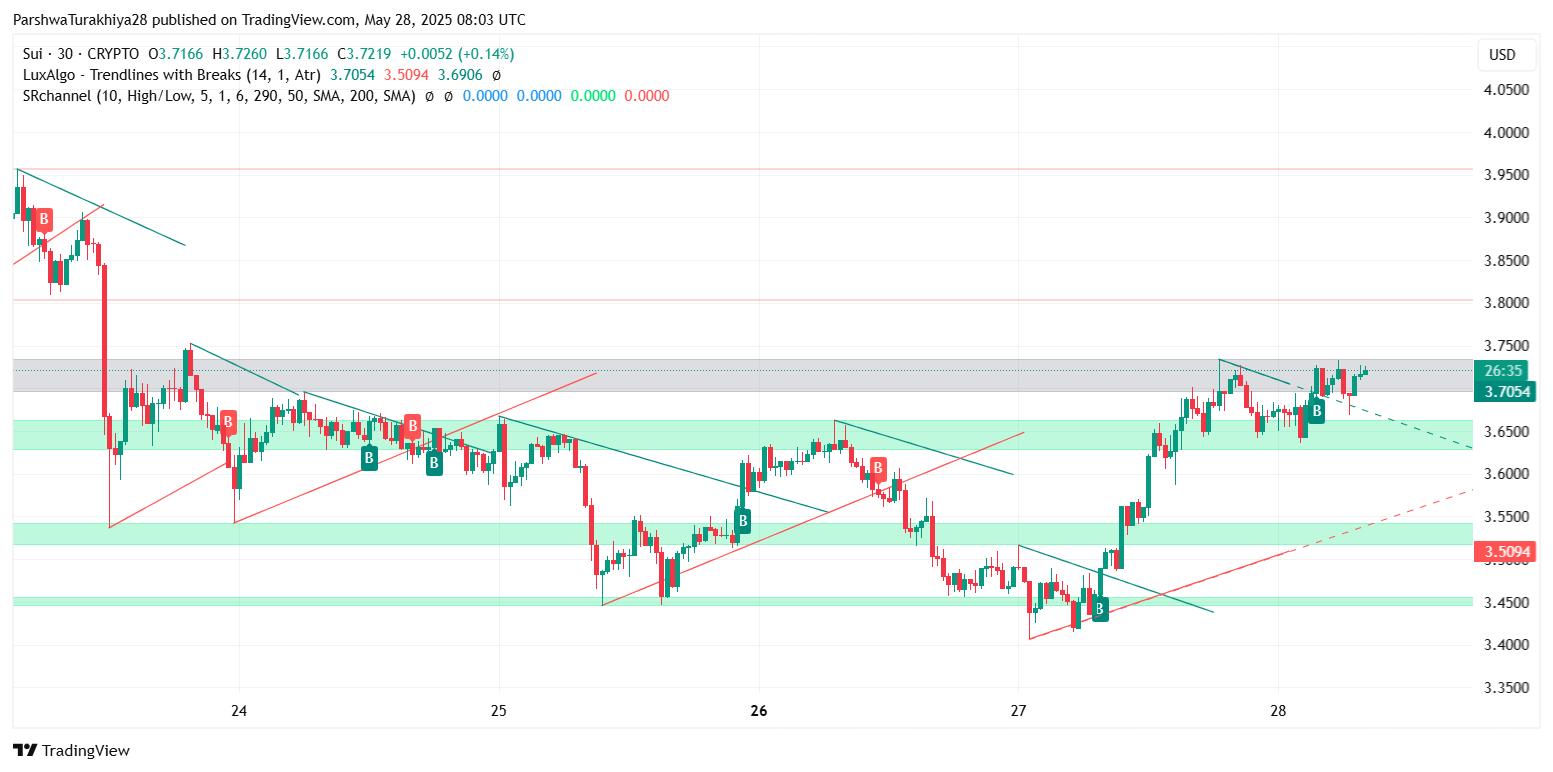
From a structural standpoint, SUI remains in consolidation within a large wedge and is nearing a critical breakout decision. A breakout above $3.80 would invalidate the current lower-high sequence and set the stage for a potential move toward $4.00–$4.25.
On the downside, support rests at:
- $3.62 (local demand zone)
- $3.50 (20 EMA cluster)
- $3.25 (mid-range breakout base)
Below that, a move back to the $3.00 handle cannot be ruled out if bulls lose strength.
Forecast Table: Key SUI Levels and Indicators
| Indicator/Zone | Level | Signal |
| Resistance 1 | $3.76 | Immediate breakout test |
| Resistance 2 | $3.92–$4.00 | Fib + structural barrier |
| Support 1 | $3.62 | Local support |
| Support 2 | $3.50 | EMA cluster support |
| RSI (4H) | 59.7 | Mildly bullish |
| MACD (30-min) | Slightly bullish | Weak momentum |
| Ichimoku (30-min) | Bullish setup | Needs confirmation |
| Bollinger Bands (4H) | Upper band push | Breakout attempt |
Disclaimer: The information presented in this article is for informational and educational purposes only. The article does not constitute financial advice or advice of any kind. Coin Edition is not responsible for any losses incurred as a result of the utilization of content, products, or services mentioned. Readers are advised to exercise caution before taking any action related to the company.