
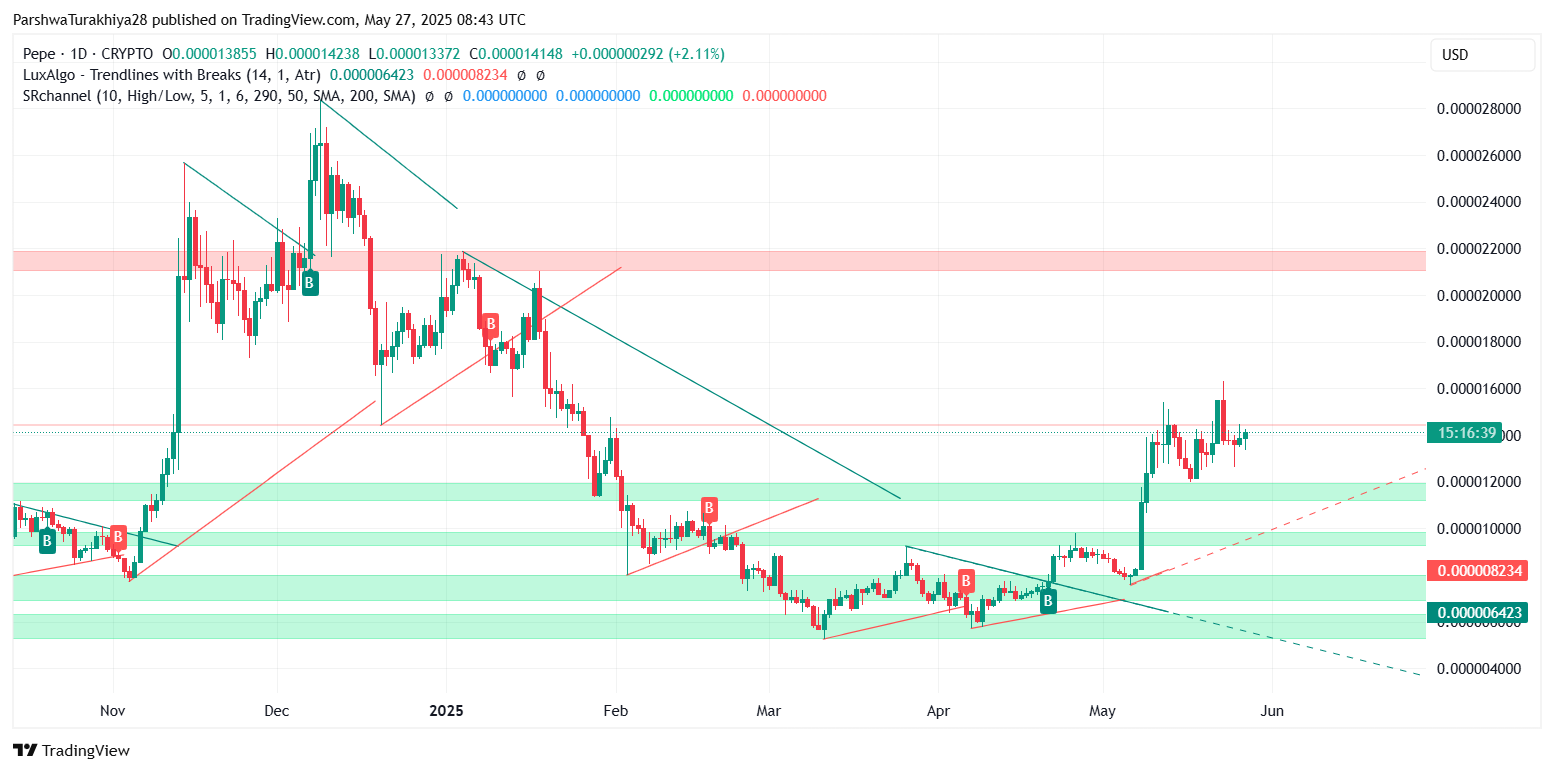
The PEPE price today is trading around $0.00001412, up nearly 3.8% in the last 24 hours, as bulls regain strength following a successful breakout from a key descending trendline. The meme token has shown renewed volatility after reclaiming multiple support levels and is now targeting the next resistance confluence near $0.00001576. Traders are closely watching the structure for continuation or early exhaustion as speculative interest returns.
 PEPE price forecast (Source: TradingView)
The recent PEPE price action reflects growing optimism in the memecoin space, with the coin staging a bounce from its $0.00001332 support and climbing past short-term moving averages. Whether this momentum sustains through May 28 may define the broader short-term trend.
What’s Happening With PEPE’s Price?
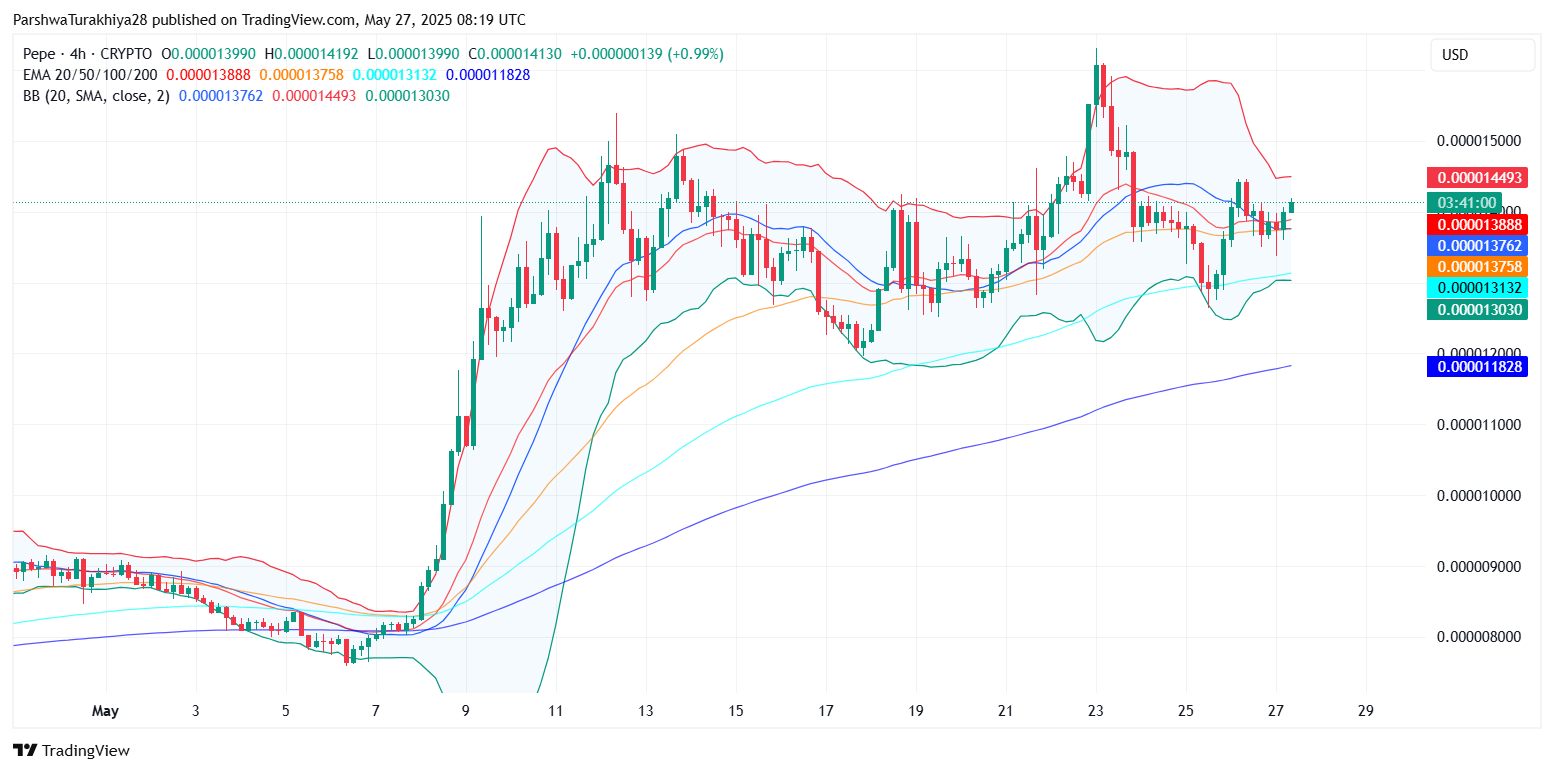
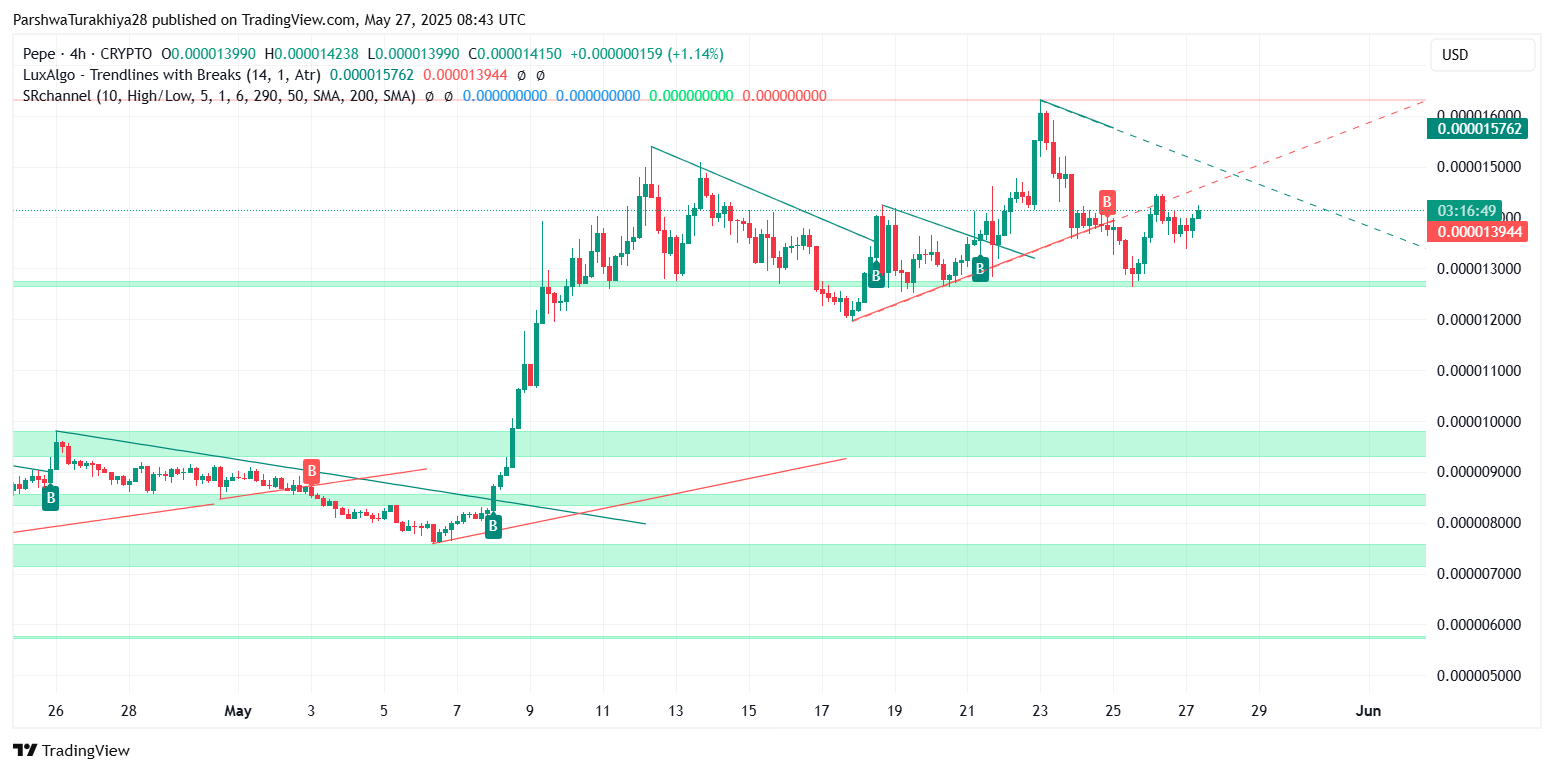
On the 4-hour chart, PEPE price has broken above a falling wedge pattern that previously capped price gains for nearly a week. The breakout was confirmed on May 27 with a decisive move above $0.00001384, flipping the previous resistance into intraday support. The current structure points toward a retest of the horizontal resistance at $0.00001576, where multiple supply zones and a former breakdown point coincide.
 PEPE price forecast (Source: TradingView)
The Bollinger Bands have started expanding, and PEPE price volatility is on the rise again. The coin is holding well above its 20/50/100 EMA cluster ($0.00001332–$0.00001388), signaling bullish alignment. Furthermore, the 200 EMA at $0.00001182 has not been tested in over a week, reinforcing the strength of the underlying uptrend from a broader perspective.
 PEPE price forecast (Source: TradingView)
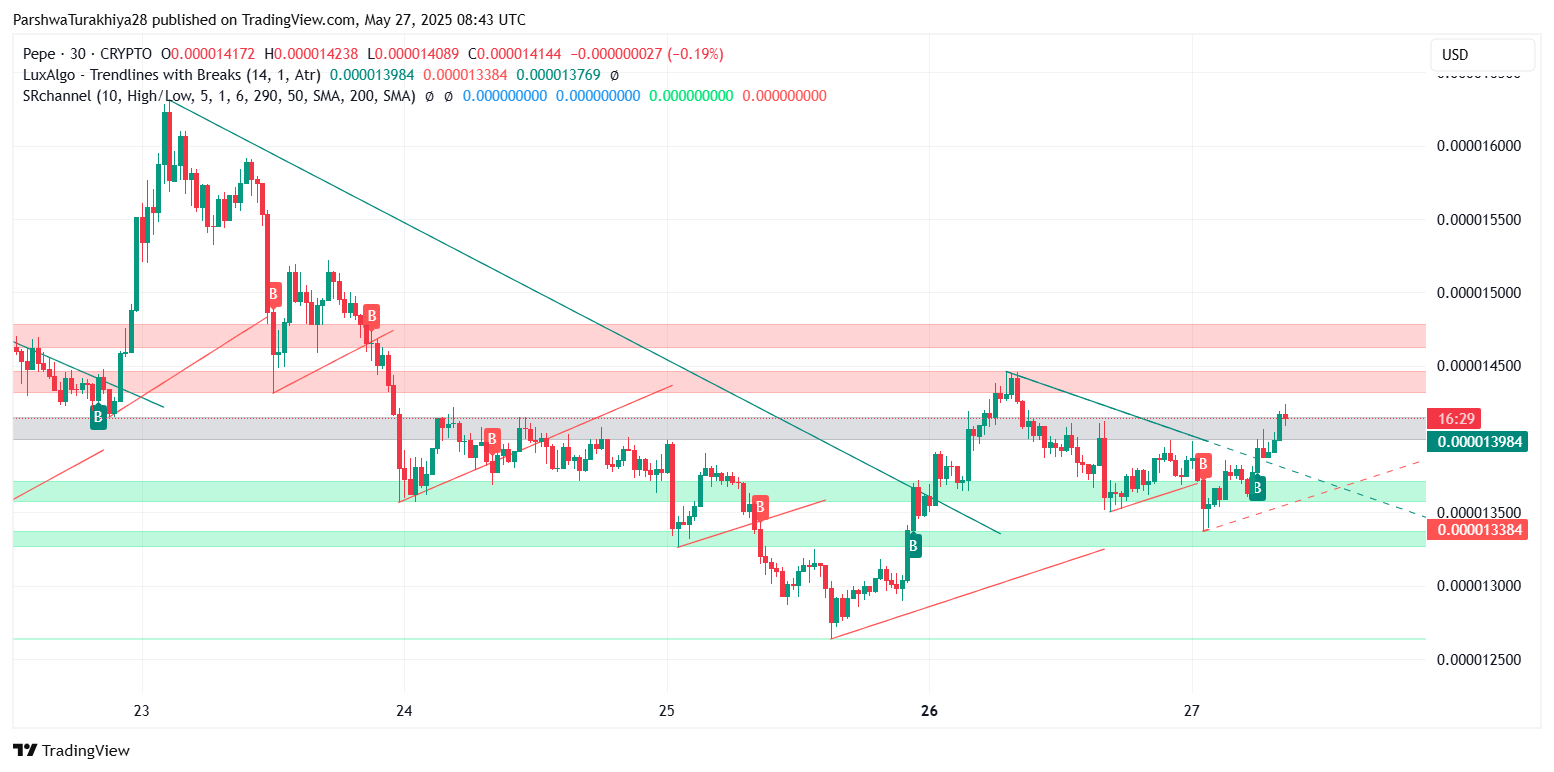
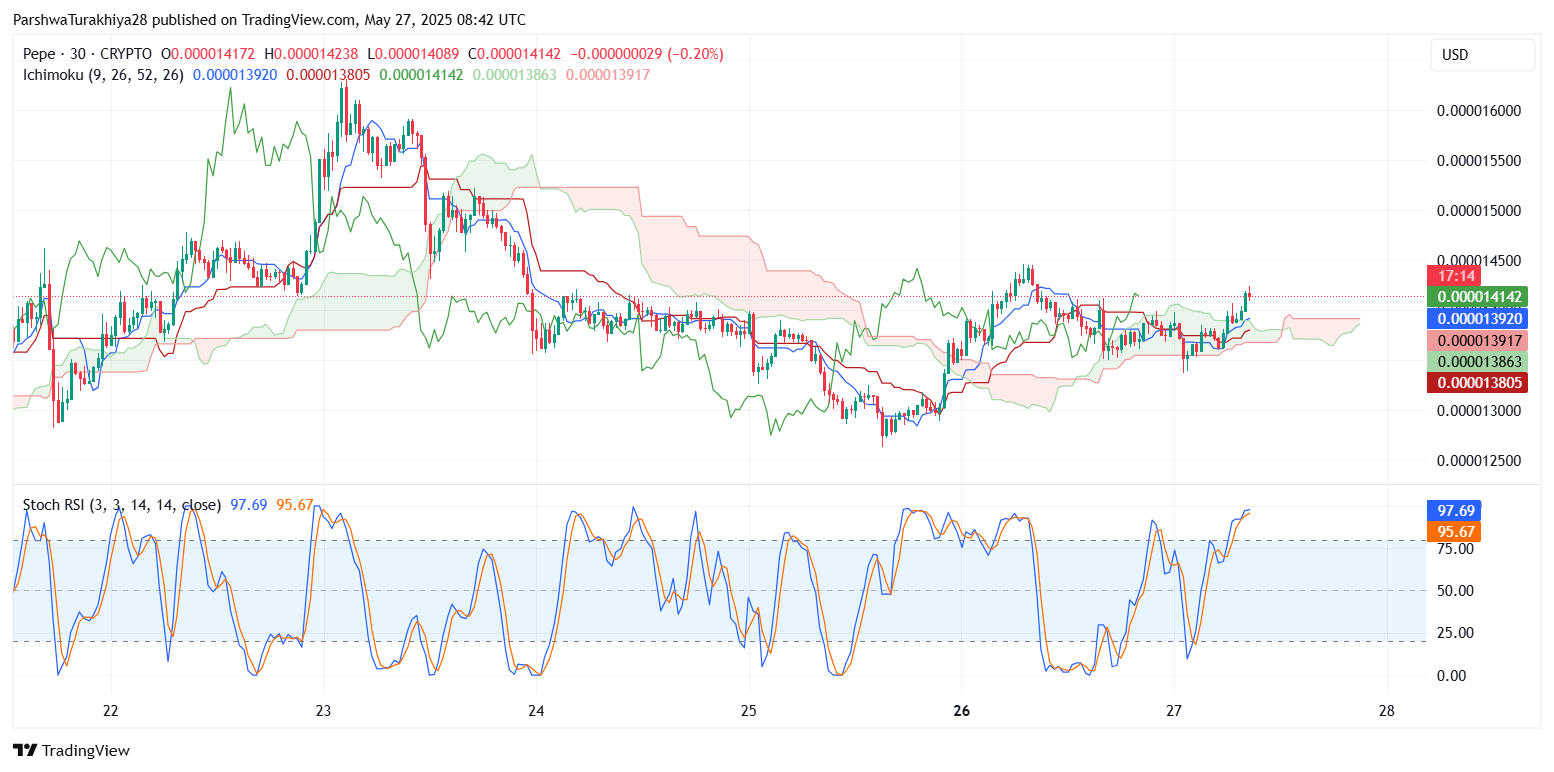
On the 30-minute chart, the coin is attempting to reclaim the mid-band of the Bollinger structure near $0.00001400, with the upper band at $0.00001449 acting as the next ceiling for intraday momentum. The narrowing band squeeze that preceded the breakout typically signals a prelude to a directional expansion, and current price behavior suggests bulls are pressing the advantage.
Why PEPE Price Going Up Today?
The question is: why is PEPE price going up today after a multi-day pullback? Three technical developments are driving today’s move. PEPE cleared a descending resistance line on the 4-hour and 30-minute charts, confirming a bullish reversal pattern. This triggered renewed entry from short-term traders looking to play the volatility spike.
 PEPE price forecast (Source: TradingView)
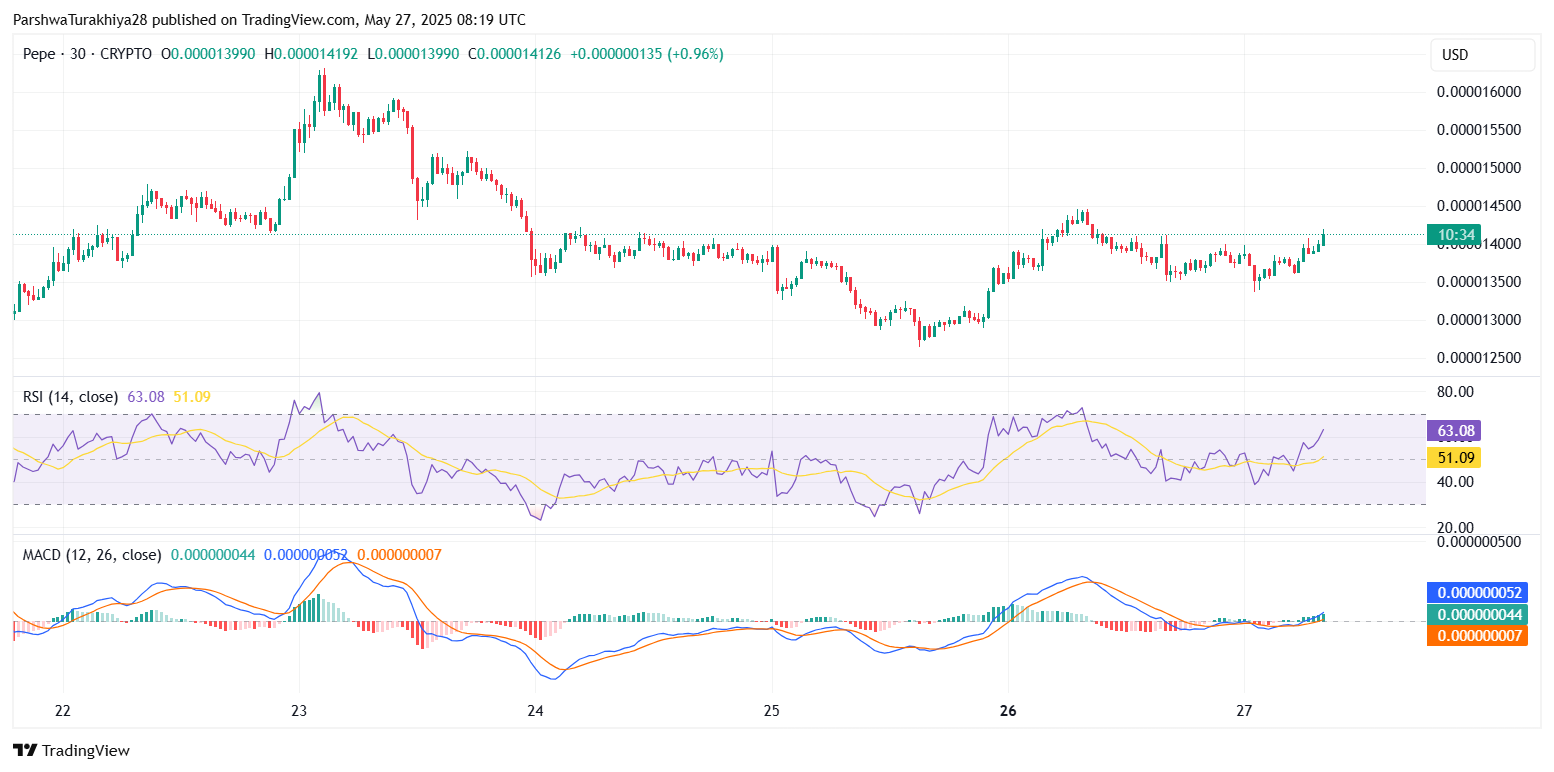
RSI on the 30-minute chart surged to 63.08, while MACD crossed bullish and flipped positive for the first time in two days. Stoch RSI is nearing the overbought zone but still supportive of further upside.
A broader uptick in altcoin appetite, likely fueled by a stabilizing Bitcoin and increased meme coin interest, appears to be lifting PEPE as one of the more speculative benefactors.
These factors together are contributing to the latest PEPE price spikes, with increasing volume confirming the strength behind the move.
Short-Term Resistance Levels and Trend Bias
 PEPE price forecast (Source: TradingView)
The next immediate resistance sits near $0.00001576. This is a pivotal zone, as it coincides with a prior rejection zone and upper boundary of the 4-hour descending channel. If bulls manage a daily close above this level with volume confirmation, the move could extend toward $0.00001750–$0.00001800.
On the downside, PEPE price update shows nearest support at $0.00001332. A breakdown below this could push the token back toward $0.00001200, which aligns with a previous breakout region and structural trendline from early May.
 PEPE price forecast (Source: TradingView)
Ichimoku analysis on the 30-minute timeframe shows the price trading above the Kumo cloud with a bullish Tenkan-Kijun cross, while the Chikou span has cleared recent candles — signaling early bullish confirmation. However, traders should monitor for any rejection at the cloud’s edge if the rally stalls near $0.00001460.
PEPE Price Forecast Table for May 28
| Indicator / Level | Value / Signal | Comment |
| PEPE price today | $0.00001412 | +3.8% daily increase |
| Immediate Resistance | $0.00001449 | Bollinger Band upper limit |
| Strong Resistance | $0.00001576 | Key breakout retest zone |
| Short-Term Support | $0.00001332 | Prior breakout support |
| Deeper Support | $0.00001200 | Structural trendline base |
| RSI (30-min) | 63.08 | Bullish momentum returning |
| MACD (30-min) | Bullish crossover | First in two days |
| Stoch RSI (30-min) | 97.69 (overbought) | Potential short-term cooling ahead |
| Bollinger Band Width | Expanding | Rising PEPE price volatility |
| Ichimoku (30-min) | Bullish cloud structure forming | Tenkan-Kijun cross above Kumo |
Final Outlook
The PEPE price is showing clear signs of bullish momentum as the token rebounds from support and pushes above key resistance trendlines. While indicators support continuation toward $0.00001576, caution is advised given overbought readings on the Stoch RSI. A minor pullback or consolidation could occur before the next breakout.
 PEPE price forecast (Source: TradingView)
As long as the PEPE price today holds above $0.00001332, bulls are in control, with a broader upside target at $0.00001750–$0.00001800. However, a failure to sustain this structure may lead to a retracement toward $0.00001200. Traders should monitor volume and intraday candlestick closes as confirmation signals in this highly volatile range.
Disclaimer: The information presented in this article is for informational and educational purposes only. The article does not constitute financial advice or advice of any kind. Coin Edition is not responsible for any losses incurred as a result of the utilization of content, products, or services mentioned. Readers are advised to exercise caution before taking any action related to the company.