
Week 19 On-Chain Data: When "Altseason Expectation" Meets the BTC Liquidity Black Hole, When Will the Bull Market Return?

Although market sentiment and prices are in a "divergence" state, due to the accumulation in the derivatives market, rapid market fluctuations are imminent. This week's expectations are largely consistent with last week, with a possibility of further short selling still present. The probability of a significant direct pullback is low.
Original Title: "Summer is Coming, BTC On-chain 'Starmap' Has Been Drawn: Cost Line as Base, HODLers as Anchor, Where is the Bull Market Ship Headed? | WTR 5.19"
Original Source: WTR Research Institute
Weekly Review
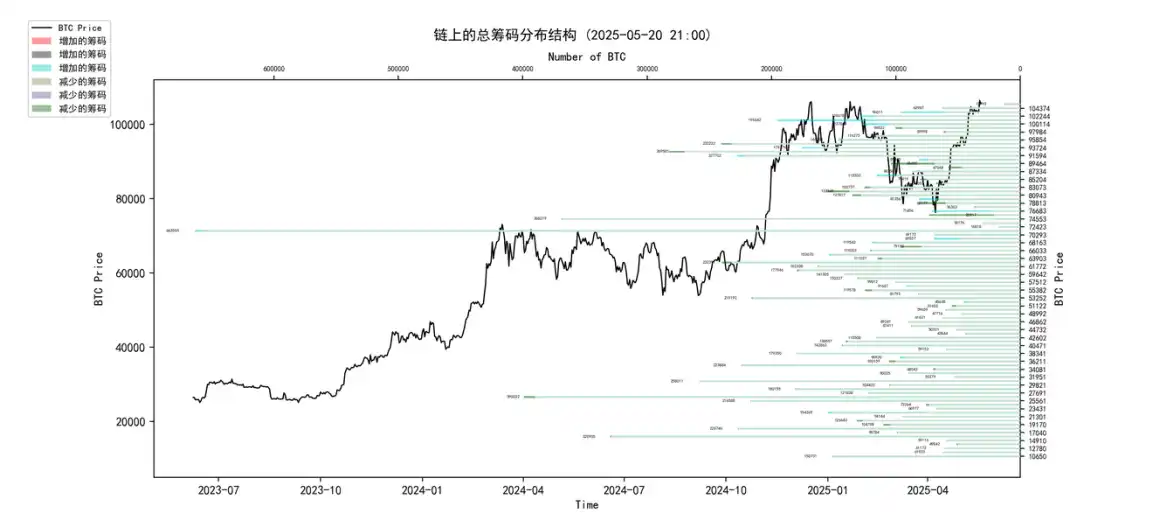
For the week from May 12th to May 19th, the highest price of Bitcoin touched near $107,108, with the lowest close to $100,718, a fluctuation of around 6.34%. Looking at the chip distribution chart, there is a significant amount of chips transacted around 93,000, providing some support or resistance.
• Analysis:
1. 60,000-68,000: Approximately 1.15 million coins;
2. 76,000-89,000: Approximately 1.08 million coins;
3. 90,000-100,000: Approximately 1.52 million coins;
• The probability of not breaking below 95,000 to 100,000 in the short term is 80%;
Important News Aspect
Economic News Aspect
1. U.S. Sovereign Credit Rating Downgrade:
◦ Moody's downgraded the U.S. sovereign credit rating from Aaa to Aa1, with the outlook adjusted to "stable" (this is the current downgrade).
◦ Review: S&P downgraded the U.S. rating from AAA to AA+ in 2011. Fitch downgraded the U.S. rating from AAA to AA+ in August 2023, with the outlook as "stable" (Fitch had placed the U.S. AAA rating on "negative watch" on May 24, 2023).
◦ Current Status: The U.S. has lost all AAA top ratings from the three major credit rating agencies.◦ Downgrade Reason (Moody's): The U.S. government's debt and interest payment ratio continue to rise, with the fiscal deficit expected to reach nearly 9% of GDP by 2035.
◦ Fed Officials' Reactions:
▪ Fed Vice Chair: Moody’s rating downgrade will be viewed as routine data in policy-making.
▪ Fed's Bostic: Moody's downgrade of the U.S. rating will impact the entire economy and financial markets, affecting the cost of capital, and will observe the impact of the rating downgrade on U.S. Treasury demand.
▪ Fed's Williams: Inflation has been gradually and slowly receding, tariffs could push up inflation and U.S. unemployment rate, and the outlook will only become clearer after June and July.
2. US Inflation and Monetary Policy Expectations:
◦ Federal Reserve Officials (Williams/Bullard): With inflation slowing down, the economy may slow down this year, and the Fed can remain patient in its monetary policy decisions.
◦ Arthur Hayes (BitMEX Co-founder, also comments on macroeconomics): The 10-year US Treasury yield is surging, and the Fed has been "reminded." If this spreads to the MOVE volatility index, the money printer is expected to start.
◦ Trump's Comments: The market consensus is that the Fed should cut rates, but Powell, who is a step behind, is likely to mess up again.
◦ Comprehensive Analysis: Moody's downgrade, US bond depreciation, tariff pressure, economic slowdown, and other factors combined. If US inflation continues its current trend in May, June, and July (April's US CPI at 2.3%), the pressure on US monetary policy/the Fed's pressure may be interpreted as a market momentum. (Meaning the market expects the Fed to potentially shift to easing as a result)
3. US Politics and Fiscal Policy:
◦ The US House group approved Trump's tax cuts bill, preparing for a possible vote this week. Last Thursday, Trump's comprehensive tax bill faced obstacles in Congress.
◦ The Washington Post reported: Media or photography equipment were not allowed at the TRUMP dinner event held on May 22.
4. US Bond Market Performance:
◦ US Bonds: Depreciation, 10-year US Treasury yield rose to 4.5%, 30-year US Treasury yield rose to 5%.
5. International Financial Collaboration and Innovation:
◦ The US New York Federal Reserve Bank and the Bank for International Settlements (BIS) jointly released a research report, Project Pine, testing the feasibility of using smart contracts to implement monetary policy in the tokenized financial market.
◦ The report points out that smart contracts have the ability to quickly deploy and adjust monetary policy tools, providing flexibility and efficiency for future central bank policy enforcement in the tokenized financial system. However, it also emphasizes the need to pay attention to interoperability, data standards, and potential operational risks.
Crypto Ecosystem News:
1. US Cryptocurrency Legislation and Regulatory Dynamics:
◦ Stablecoin Legislation "GENIUS Act":
▪ US Senators Bill Hagerty and Kirsten Gillibrand stated that the US regulation of stablecoin issuers legislation, the "GENIUS Act," may enter the debate and approval stage this week.
▪ Bo Hines, Executive Director of the U.S. President's Digital Asset Advisory Committee, stated that the main purpose of the "GENIUS Act" is to safeguard the future of American finance, promote the modernization of America's outdated payment systems, and that digital asset technology represents the next generation of the financial system, for which the U.S. is ready for this transformation.
◦ SEC Update:
▪ The U.S. Securities and Exchange Commission (SEC) released Frequently Asked Questions (FAQs) related to cryptocurrency activities and distributed ledger technology, covering broker-dealer custody rules, in-kind creation of cryptocurrency ETFs, net capital treatment for BTC and ETH, and the transfer agent rules for digitized securities.
◦ Texas BTC Reserve Bill:
▪ The U.S. state of Texas' Strategic BTC Reserve Bill (SB 21) will undergo its second reading in the House on May 20. This is a necessary step before the final vote. If the bill passes the full House vote on June 2, it will be sent to the governor for signature.
2. Cryptocurrency Market Performance and Analyst Views:
◦ Analyst Daan Crypto Trades: Recently, there has been a consistent Coinbase (CB) spot premium, which is a positive sign indicating strong demand.
◦ Arthur Hayes' View: The altcoin season is approaching, waiting for BTC to break $110,000 and continue to rise in volume towards the $150,000-$200,000 range. This scenario is expected to occur in the summer or early third quarter of this year, after which rotation into various altcoins will start.
◦ CryptoQuant Report: The ETH/BTC ratio has dropped to historically rare levels, and historically, whenever this metric reaches similar lows, ETH has seen significant increases. Currently, ETH/BTC has rebounded significantly, indicating that investors are betting that the market has bottomed out, and the altcoin season may arrive soon.
◦ Analyst Apsk32's View: BTC usually follows its gold rally after a few months, with gold hitting a new high of $3,500 per ounce. If BTC continues to evolve along the momentum curve and gold maintains its current price, while BTC's price returns to the five-year leading support track, BTC's target price for 2025 could be around $220,000.
◦ Matrixport Report: With the gradual easing of phase-down risks, the upward path of BTC has become clearer. Risky assets, especially BTC, are expected to have a favorable window before July, which coincides with the end of the 90-day tariff halt agreement and the start of the second-quarter earnings season. Another significant catalyst is the FTX's initiation of the debt payment process around May 30, targeting accounts with debt amounts exceeding $50,000, expecting to issue approximately $5 billion in stablecoins. Liquidity may help drive market momentum in June, and the uptrend is expected to continue into the summer.
◦ Overall Market Sentiment: "BTC is holding strong near its all-time high, waiting for a catalyst, and ETH is also not showing weakness."
3. Cryptocurrency ETFs and Fund Flows:
◦ Last Week: US BTC Spot ETF saw a total inflow of $608 million, US ETH Spot ETF saw a total inflow of $41.8 million.
◦ DeFiLlama Data: Total stablecoin market cap reached $243.838 billion, with a 0.45% increase in the past 7 days.
4. Institutional and Whale Holding Dynamics:
◦ MicroStrategy (Strategy): Increased holdings by 7,390 BTC between May 12th and May 18th at a price of $103,498 per BTC, totaling $764.9 million.
◦ Metaplanet: Added 1,004 BTC to its holdings, now holding a total of 7,800 BTC.
◦ El Salvador: Added 31 BTC over the last 30 days, holding a total of 6,180.18 BTC.
Long-Term Insights: Used to observe our long-term situation; Bull Market/Bear Market/Structural Changes/Neutral State
Medium-Term Analysis: Used to analyze the current stage we are in, how long it might last, and what scenarios we might face during this stage
Short-Term Observations: Used to analyze short-term market conditions; as well as the emergence of trends and the likelihood of certain events under certain conditions
Long-Term Insights
• Illiquid Long-Term Whales
• BTC Spot Sellers' Total Wind Down Risk Ratio
• BTC US Spot ETF Fund Flows
• Exchange Large Inflow-Outflow Net Position
(Illustration of Illiquid Long-Term Whales below)
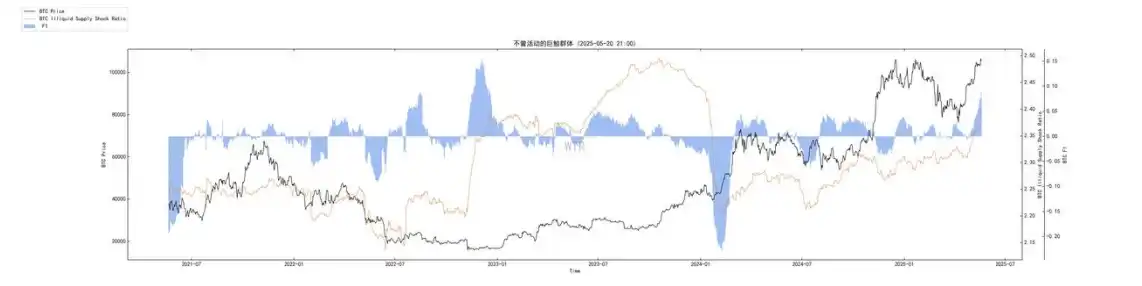
Have remained at a relatively high level recently, showing further upward momentum in the latest data. This indicates that the non-moving, long-term BTC whales in the market are steadily increasing, HODLer confidence remains strong, and the potential selling pressure is relatively low. The illiquid long-term whales are moving in sync with the price's moderate rise, demonstrating healthy support and upward momentum.
(Illustration of BTC Spot Sellers' Total Wind Down Risk Ratio below)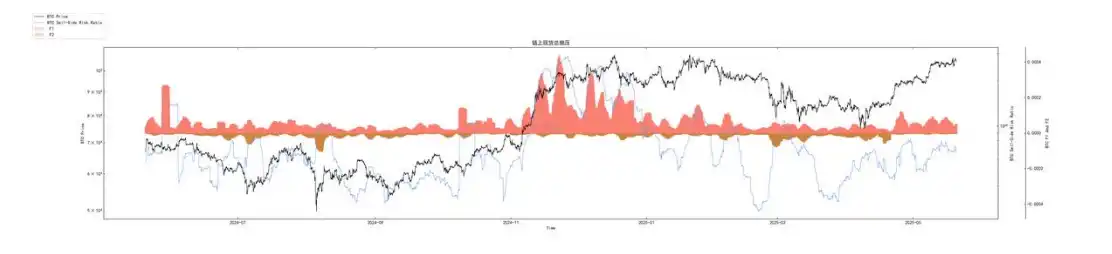
The funding rate is currently at a relatively moderate level. Although it has risen slightly with the price increase, it is far from the high-risk zone seen at the peak of a historical bull market. This indicates that the current market's uptrend is not driven by excessive leverage or short-term speculative frenzy, and the pressure to take profits is relatively manageable.
(Chart below shows BTC US Spot ETF Fund Flow)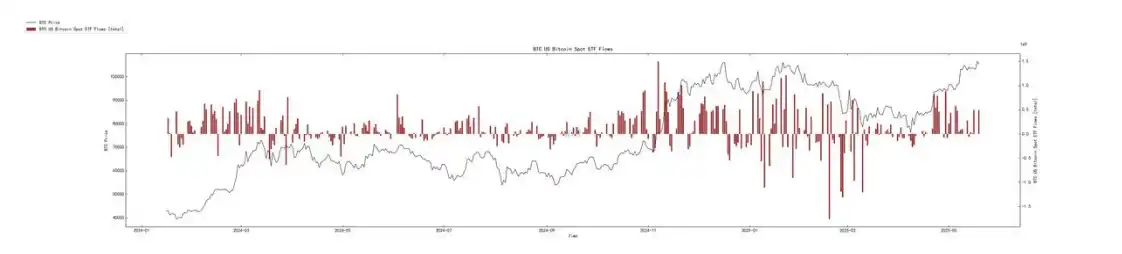
After experiencing a period of fund inflows fluctuating even briefly flowing out, the rightmost part shows that ETF fund's net flow has recovered and maintained a positive trend. Although the daily inflow volume may not match the initial peak, the continuous net inflow indicates that capital from the traditional financial markets is actively and steadily allocating to BTC. There is a strong positive correlation between price and ETF fund flows, and the recent steady price increase is in sync with the ongoing net inflows into ETFs.
(Chart below shows Exchange Large Transaction Net Flow)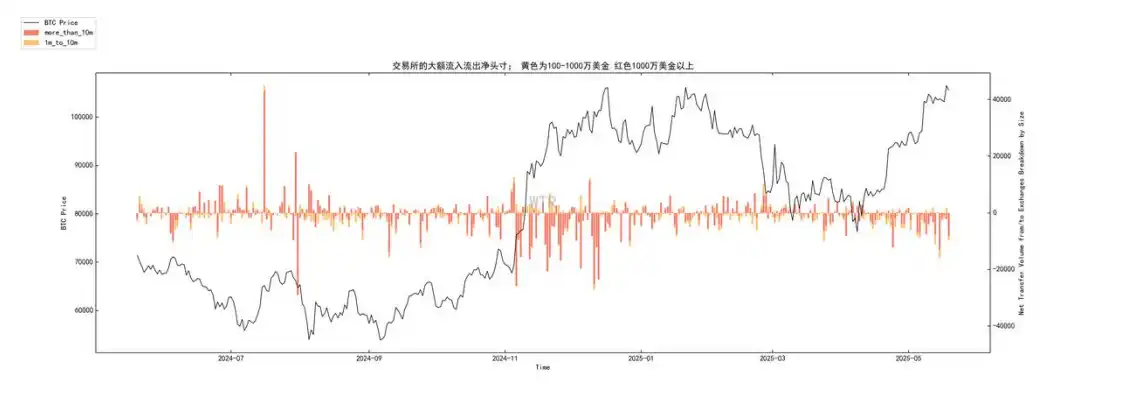
• Red Bar (> $10 million): After the price surged to a high level, although there were occasional intermittent net inflows (possibly representing some whales' risk management or minor cash-outs), there was no trend of continuous large-scale BTC transfers to exchanges. In recent days, there has even been a weak net outflow or a balanced state.
• Orange Bar ($100-1000 million): The performance is more mixed, but overall, there are no signs of panic selling or large-scale concentrated selling. Overall, the selling pressure from large addresses is relatively manageable, and there is no sustained selling pressure. Instead, the recent balance or weak net outflows suggest a reluctance to sell and potential accumulation behavior. During the price rally, the pressure from large net inflows to exchanges is not significant, providing a favorable environment for further price support.
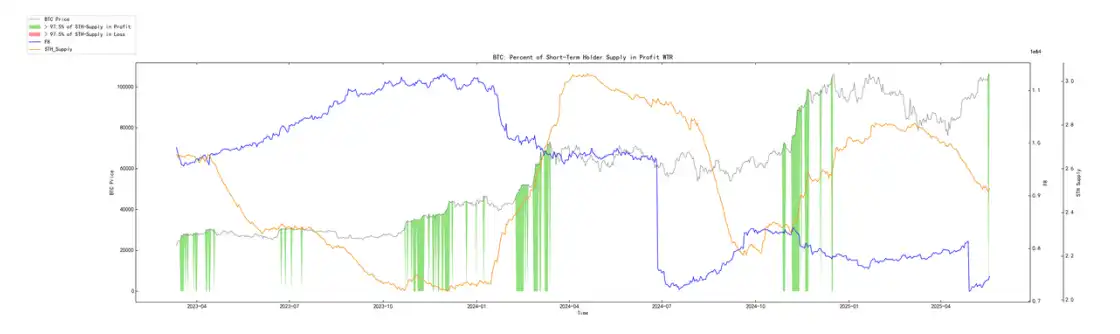
(Chart below shows Short-Term Holders Realized Cost)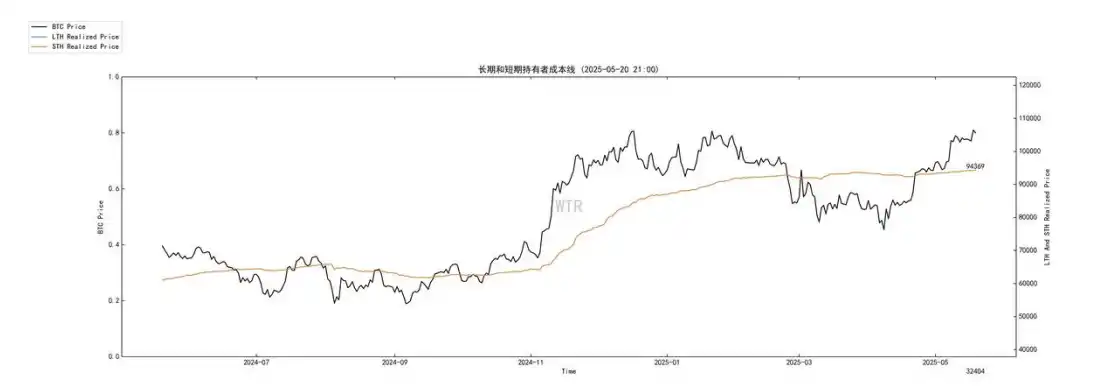
The short-term speculators' cost line (approximately $94,345, estimated from the chart) is slowly rising, indicating that the average holding cost of long-term holders is continuously increasing, which typically occurs in a bull market as new long-term holders enter at higher prices. The current BTC price is well above the STH cost line.
• BTC Price> STH Cost> LTH Cost: It is a very typical bull market market structure.
• Price Far Above STH Cost: Indicates that short-term holders are currently in a significant profit state, which is one of the sources of confidence for them to continue holding.
Analysis Combining On-Chain Data and News Sentiment
1. Starting Point: Loose Expectations Amid Macro Uncertainty + Gradual Regulatory Clarity (News & Chart Three)
◦ News: The downgrade of the U.S. sovereign credit rating has raised concerns about the long-term credit of the U.S. dollar, with the market expecting this to potentially pressure the Federal Reserve into adopting a looser monetary policy in the future (Arthur Hayes' "money printer" argument). Meanwhile, regulatory developments such as the stablecoin bill have brought positive expectations to the market.
◦ Chart Three (ETF): The continuous net inflow of ETF funds is a direct response to macro expectations and positive regulatory signals, indicating that traditional funds are still entering the market.
◦ Analysis: Macro-level "bad news" (credit risk) has been interpreted by the market as "good news" for crypto assets (safe haven demand + loose expectations). The gradual regulatory clarity has reduced uncertainty, strengthening confidence in inflows of funds.
2. Continuation: HODLer Confidence Soaring and Continuous Supply Tightening (Chart One & Chart Five)
◦ Chart One (Illiquid Long-Term Whales): The illiquid supply continues to increase, indicating that HODLers are not only not selling massively at the current price level but also have strong hodling sentiments, even accumulating more, leading to a further reduction in the actual tradable BTC supply in the market.
◦ Chart Five (Short-Term Speculator Cost): The BTC price is far above the average cost of both long-term and short-term holders, implying that the vast majority of market participants are in a profit state. Especially the massive profits of long-term holders are a key foundation for their strong holding conviction. The STH cost line, as a critical bull market support, is currently far behind.
◦ News: Institutions like MicroStrategy continue to accumulate BTC, confirming the optimism of long-term holders and smart money.
◦ Analysis: Strong hodling behavior + widespread profit state + supply shock effect minimal market selling pressure, forming extremely strong support for the price.
3. Validation: Whale Behavior is Stable and Market Risk is Controllable (Chart Two & Chart Four)
◦ Chart Four (Large Transaction Platform Net Flow): Large transaction platform addresses have not shown continuous net inflows (selling) but occasional outflows (accumulation or transfer to cold wallets), indicating that whales still have a positive outlook on the future and are not in a hurry to cash out.
◦ Chart Two (Spot Sell Pressure Ratio): The spot sell pressure ratio is at a moderate level, indicating that although the market sentiment is positive, it is far from reaching a manic or overheated state, with little short-term profit-taking pressure.
◦ Chart 1 (Illiquid Long-Term Whale): Also confirms that the market has not yet entered the euphoric phase of the bull market peak (at least not selling).
◦ Analysis: The stability of whale behavior and the controllability of overall market risk have provided a healthy internal environment for further price appreciation.
4. Progression: Breakthrough Expectations and Rotation Momentum (On the News Front)
◦ News Front: Analysts are generally optimistic about BTC surpassing its all-time high (Arthur Hayes' targets of $110,000, $150,000–$200,000) and expect capital to rotate into altcoins (the rebound of the ETH/BTC exchange rate is a signal). Events such as FTX's liquidity injection are seen as potential catalysts.
◦ On-Chain Correlation: Current on-chain metrics collectively point to a healthy, poised bull market structure. Once BTC breaks upwards, given its scarcity and strong buy-side support, it may quickly attract more attention and funds.
◦ Analysis: On-chain data has provided a solid foundation for the optimistic expectations on the news front. BTC is on the verge of completing a "catalyst wait," after which the logic of the altcoin season rotation is expected to be activated.
Future Outlook:
• Mid-term Outlook :
◦ BTC has a reasonable probability of further upward movement and challenging/surpassing its all-time high: All on-chain indicators (illiquidity supply, LTH/STH cost far below current price, mild selling pressure, continuous ETF inflows, whale selling absent) support this assessment. Loose policy expectations and regulatory favorability on the news front will be key catalysts.
◦ The STH cost line (around $94,369) is a crucial short-term support: Even in the event of a pullback, as long as this line is not effectively breached, the short-term uptrend is not expected to change.
◦ Conditions for the altcoin season are becoming increasingly mature: Once BTC effectively breaks through and stabilizes, the overflow effect of funds will significantly strengthen. The performance of the ETH/BTC exchange rate will be a key indicator. FTX's compensation (if it occurs as expected) may ignite enthusiasm for altcoins.
◦ Variables to watch: Do macro data (such as inflation and employment) support loose expectations? How will the actual implementation of regulatory bills unfold? Can ETF fund inflows be sustained?
• Mid-to-Long-term Outlook :
◦ Increased certainty in the depth of the bull market development: The current on-chain structure (especially the STH cost shown in Chart 5, far below the current price) is a healthy feature of a typical mid-term bull market, predicting greater upside potential. The illiquid long-term whales also support this assessment.
◦ STH Cost Line (approximately $94,345) is the "lifeline" of this bull run: As long as the price can consistently stay above it and drive a steady rise, the bull market structure remains solid.
◦ Target Price and Wind Risk: Analysts predict a year-end BTC price of over $200,000 in 2025, supported by current on-chain data and macro expectations, which is not a pipe dream (although the current probability is still relatively low). However, as the price continues to climb, close attention needs to be paid to the long-term whales in Chart One and the spot selling wind risk ratio in Chart Two. If they rapidly approach or enter the historical high-risk zone, it indicates that market risk is rapidly accumulating, and selling pressure will greatly increase.
◦ Long-Term Drivers: The actual degree of U.S. monetary policy easing, global demand for hedging inflation and sovereign credit risks, and the improvement of crypto regulatory frameworks will be the core factors determining the height and length of this bull market.
Mid-Term Exploration
• Long-Term Participant Supply Ratio
• Liquidity Supply
• Whale Exchange Net Position
• ETH Exchange Circulation Ratio
• Short-Term Profit Structure Composite Model
(Chart of Long-Term Participant Supply Ratio)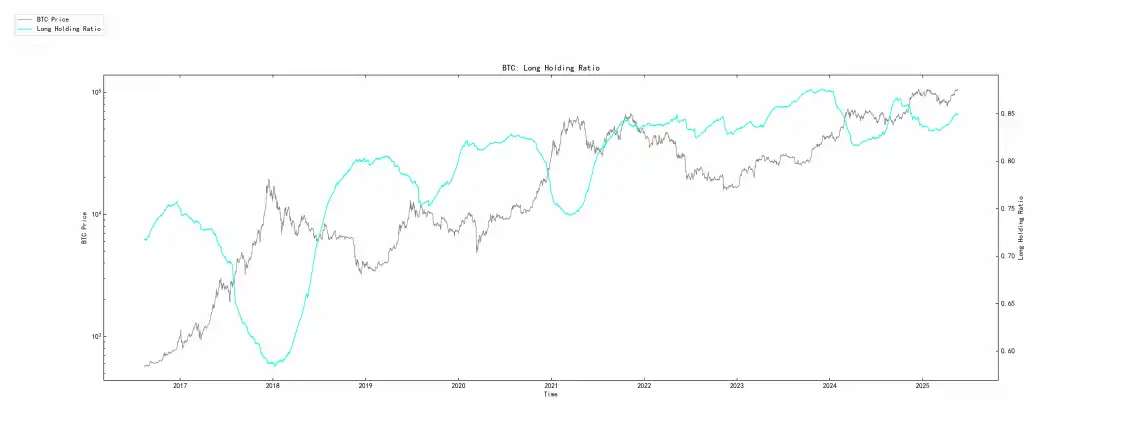
The gradual contraction of the market's long-term supply chips is squeezing the selling space of short-term chips within the field, showing a significant amount of uptake at present. From the current basic situation, an increase in long-term chips will make the market pricing more stable. Of course, the premise is that short-term supply can be well replenished. Possibly, in general, the compression of long-term supply and the space available for sale of short-term supply may indirectly reduce the number of short-term chips in the field. Factors driving pricing may require some updates to the supply volume.
(Chart of Liquidity Supply)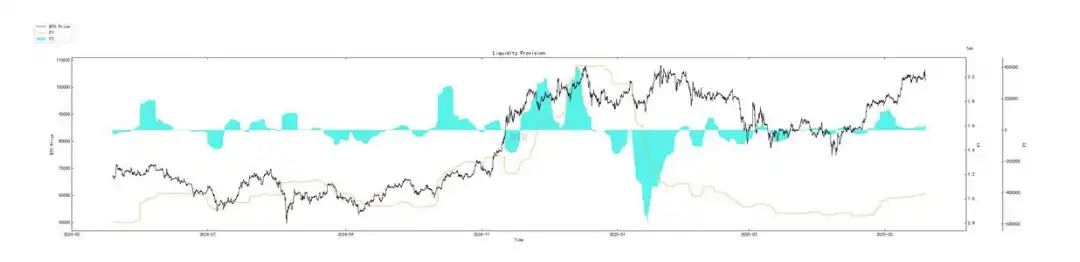
The current volume of liquidity supply is still in a healthy state, indicating that the market also has some new supply support. The current pricing may still hover in a stable range.
(Chart of Whale Exchange Net Position)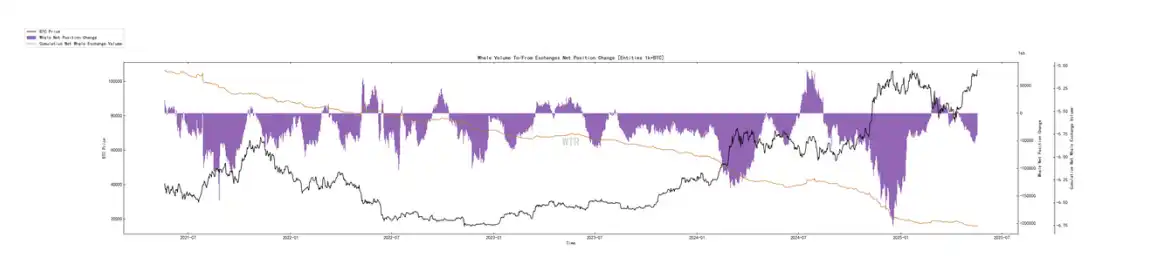
Whales are continuously accumulating the chips in their hands. There is no sign of this group trending towards "shifting to exchange selling." At present, it still shows a weak accumulation structure.
(Chart Below: ETH Transaction Platform Circulation Ratio)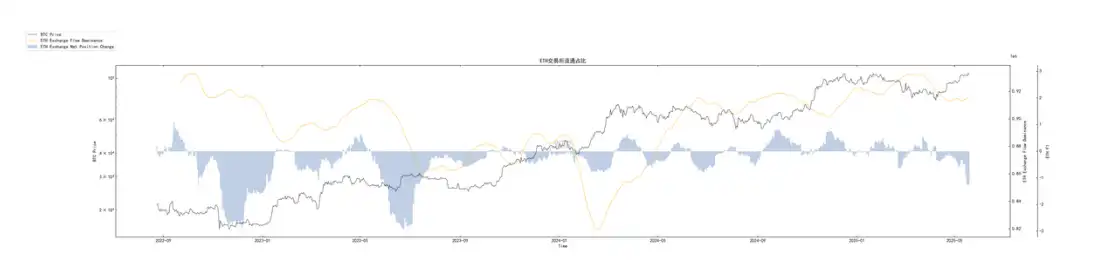
ETH's circulation ratio on centralized exchanges has decreased. Even as BTC remains at a higher price level, the market still leans towards seeking stability rather than impulsively participating in high-risk projects. The current market primarily hoards BTC, which may result in a stable BTC pricing structure. Small-cap projects may face a BTC liquidity drain and temporary price decline due to the lack of BTC overflow liquidity.
(Chart Below: Short-Term Profit Structure Composite Model)
BTC is currently in a phase of short-term supply-side profit overflow, which may lead to selling pressure to take profits, creating resistance in the market.
Short-Term Observations
• Derivative Risk Factor
• Options Intent Transaction Ratio
• Derivatives Trading Volume
• Options Implied Volatility
• Profit and Loss Transfer Amount
• New and Active Addresses
• Sugar Orange Exchange Net Long/Short Ratio
• Auntie Exchange Net Long/Short Ratio
• Heavy Weighted Selling Pressure
• Global Buying Power Status
• Stablecoin Exchange Net Long/Short Ratio
• Off-chain Exchange Platform Data
Derivatives Rating: The risk factor is in the red zone, indicating high derivative risk.
(Chart Below: Derivative Risk Factor)
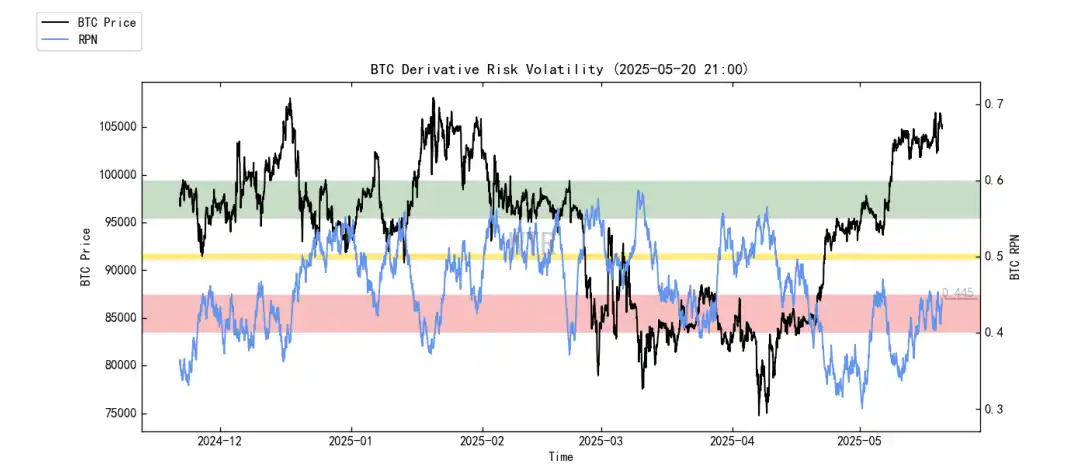
The risk factor has oscillated in the red zone for a week without triggering liquidation for either long or short positions. It currently remains in the red zone, with an expectation of significant market volatility in the derivatives market this week, potentially leading to liquidations for derivative participants.
(Chart Below: Options Intent Transaction Ratio)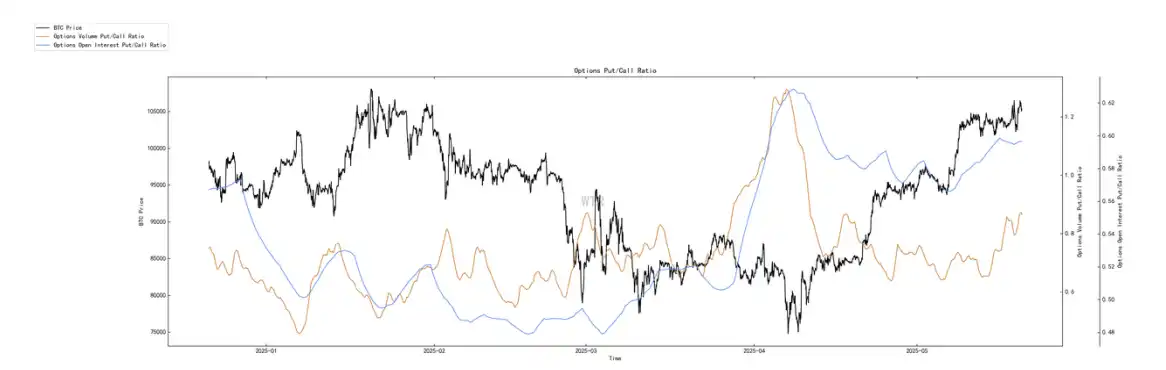
The put option ratio has slightly increased, with moderate growth in trading volume.
(Chart Below: Derivatives Trading Volume)
Derivatives trading volume is at the median.
(Next Chart: Option Implied Volatility)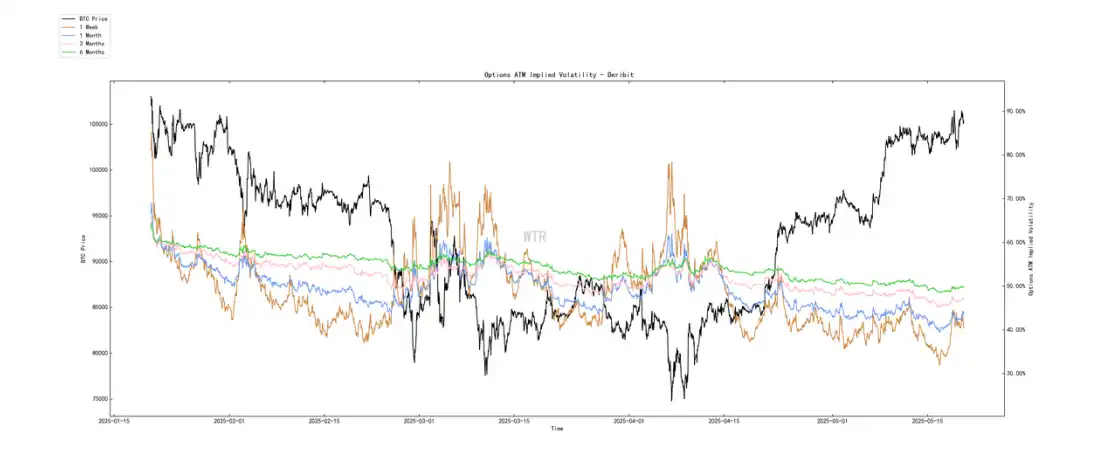
Option implied volatility has seen only a small fluctuation in the short term.
Sentiment Rating: Neutral
(Next Chart: Profit and Loss Transfer Amount)
Despite the gradual price increase, the market's positive sentiment (blue line) has been in a continuous "divergence" with the BTC price. In the short term, this may have no effect on the price, but in the medium term, this is not a good sign.
(Next Chart: New Addresses and Active Addresses)
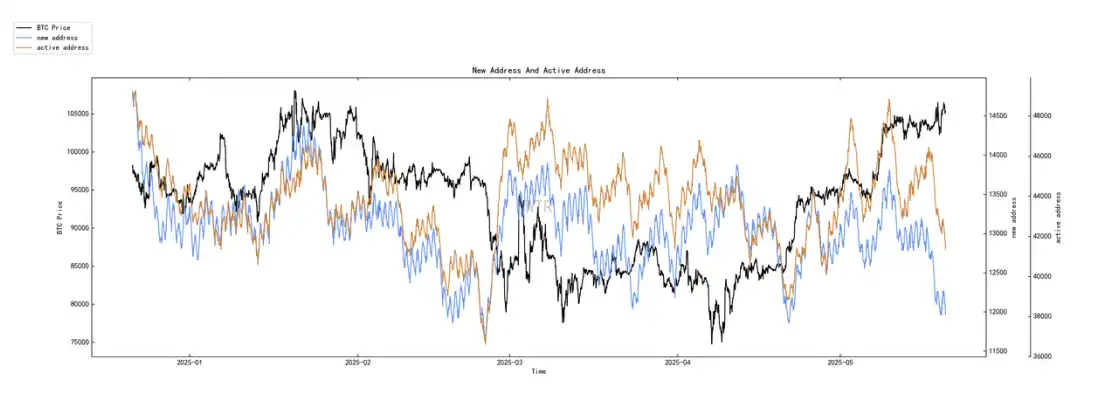
New active addresses are at a low level.
Spot and selling pressure structure rating: BTC and ETH are experiencing continuous large outflows.
(Next Chart: Bitocracy Exchange Net Position)
Currently, BTC is experiencing continuous large outflows.
(Next Chart: Etherarchy Exchange Net Position)
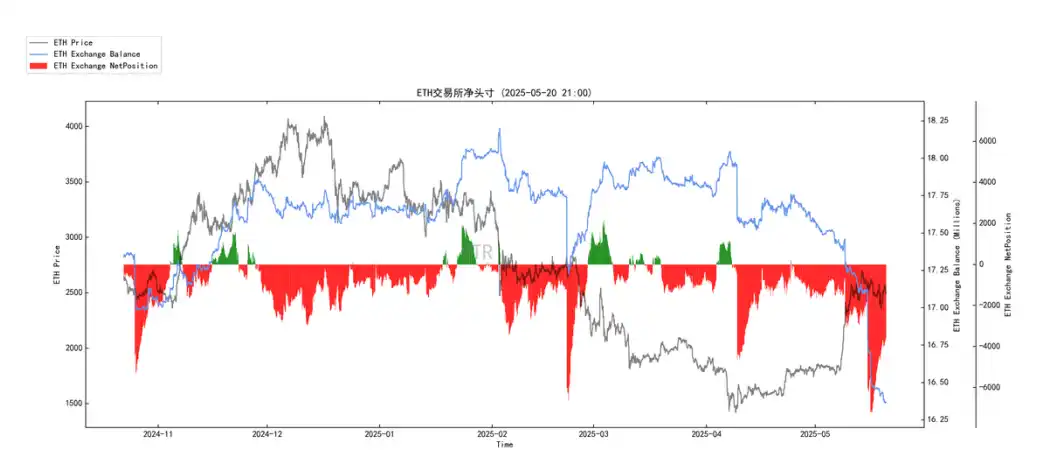
Currently, ETH is experiencing continuous large outflows.
(Next Chart: High-Weighted Selling Pressure)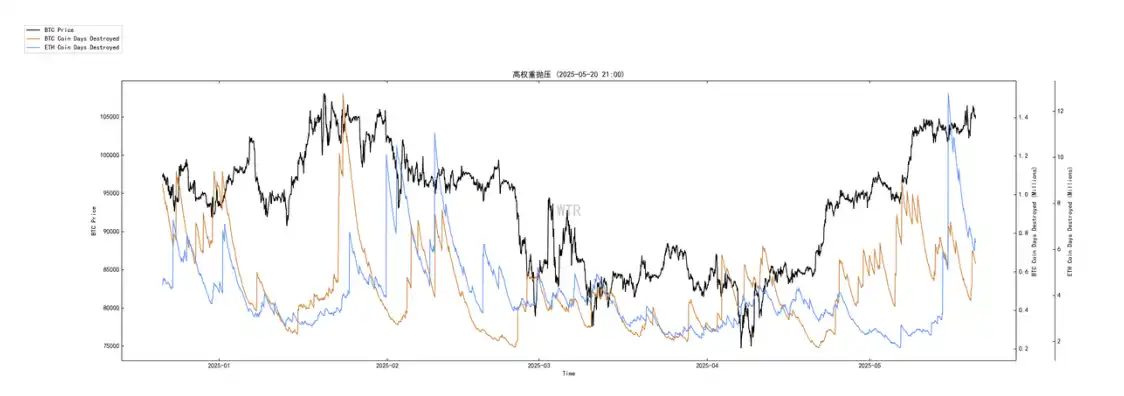
ETH has experienced a significant amount of high-weighted selling pressure, but it has currently eased.
Buyer Power Rating: Global buyer power has slightly rebounded compared to last week, stablecoin buyer power has seen a slight loss.
(Next Chart: Global Buyer Power Status)
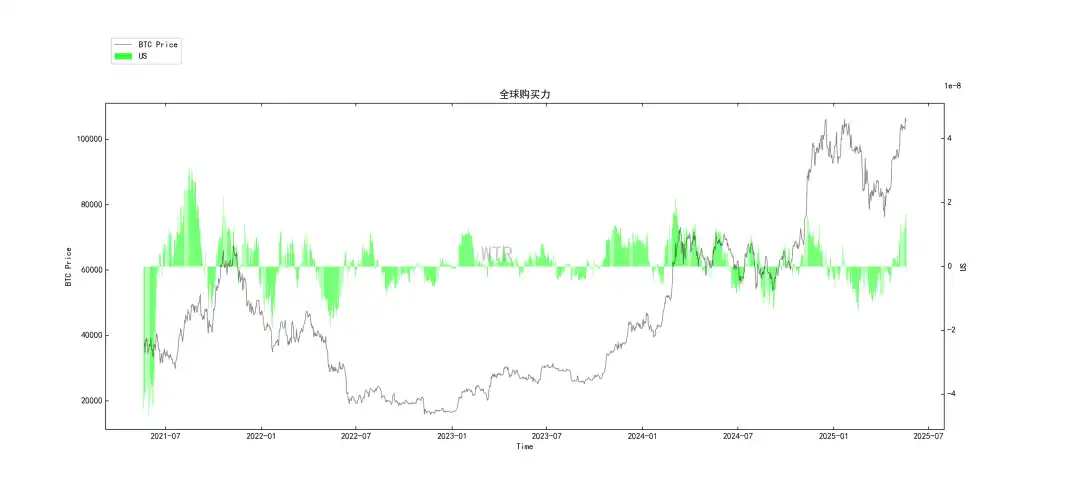
Global buyer power has slightly rebounded compared to last week.
(Chart below shows USDT Exchange Platform Net Inflows)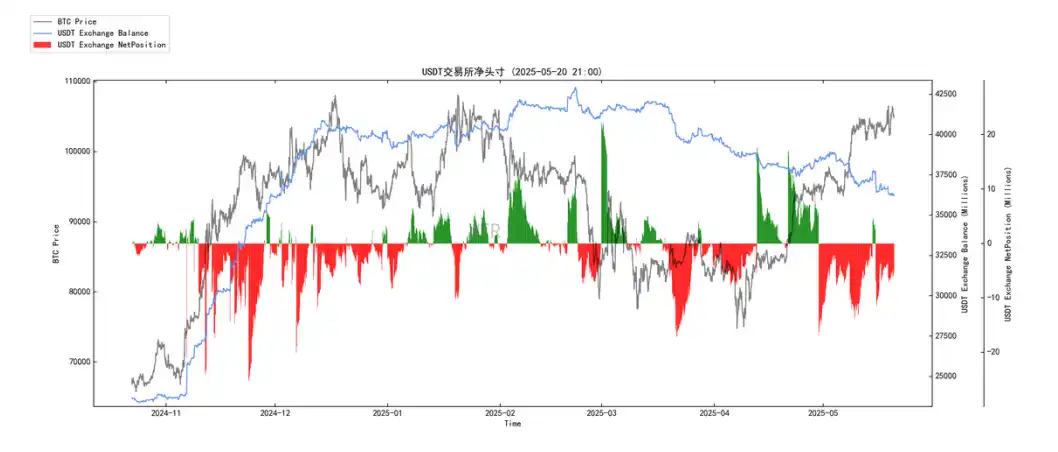
Stablecoin Purchase Power Suffers Minor Drain.
Off-chain Transaction Data Rating: Website data outage this week, no off-chain transaction data currently available.
Weekly Summary:
News Analysis and Summary:
1. Starting Point: Macro Pressure Forcing Policy Pivot Expectation
◦ US Sovereign Credit Rating Collapse to AAA+ continued debt and deficit pressure + potential economic slowdown signals Market expects the Fed to be forced into a more accommodative monetary policy in the future (possibly visible in summer or later), despite short-term cautious official statements.
2. Transmission to Crypto Market: Dual Benefit of Safe-haven Nature and Liquidity Expectation
◦ Long-term damage to US Dollar credit some funds may seek alternative store of value, BTC's "digital gold" narrative once again in focus.
◦ Future Fed easing expectations market liquidity improvement expectations positive for risk assets, with the crypto market as a high-beta asset set to benefit.
3. Positive Internal Factors in Crypto: Regulatory Clarity and Continued Capital Inflows
◦ Progress in Stablecoin legislation + Clear SEC operation guidance reducing regulatory uncertainty, paving the way for institutional entry.
◦ BTC/ETH ETF continues to attract funds + institutional/national accumulation real buying support for the market.
◦ Expectations of short-term liquidity injections such as FTX reimbursements further enhance market confidence.
4. Market Sentiment and Capital Signals Resonate: Breakout and Rotation Expectations Heating Up
◦ Analysts are generally bullish + ETH/BTC exchange rate rebound + DeFi Season high expectations positive market sentiment.
◦ BTC consolidating near historical highs, waiting for catalyst to complete breakout once breakout occurs, may trigger capital rotation to ETH and other altcoins.
• Short to Mid-term Outlook:
◦ The core drivers of the "Summer Offensive" are the resonance of "accommodative expectations" and "regulatory clarity".
◦ BTC May Attempt to Break All-Time High: Under macro pressures, any dovish remarks or data from the Federal Reserve (such as inflation persistently below expectations), as well as positive regulatory developments (such as the stablecoin bill passing), could serve as catalysts for BTC's breakthrough. Arthur Hayes' proposed path for BTC to surge to $150,000-$200,000 after breaking $110,000 is worth noting.
◦ Altseason Launch Window Period: If BTC successfully breaks through and holds steady, a capital rotation effect is expected to occur. The ETH/BTC exchange rate is a key metric to watch. FTX's stablecoin refund (if it occurs in June) may be one of the direct ignition sources for the altcoin market launch. The favorable window period pointed out by Matrixport in July is also worth looking forward to.
◦ Risks: Unexpectedly hawkish actions from the Federal Reserve in the short term (although less likely, cannot be completely ruled out), unforeseen negative regulatory news, or a failed BTC breakthrough could lead to a market pullback.
• Mid-to-Long-Term Outlook:
◦ The Actual Direction of US Monetary Policy is Key: If the Federal Reserve indeed initiates a rate-cutting cycle and restarts its balance sheet expansion ("printing press on"), it will provide continued macro liquidity support for the crypto market.
◦ Gradual Maturation of Regulatory Framework: With legislation such as the stablecoin bill in place, the US crypto regulatory framework will become clearer, attracting larger-scale traditional capital inflows. Explorations into tokenized finance by central banks like Project Pine also indicate the future direction of the financial system.
◦ Long-Term Value Narratives for BTC and ETH: BTC's value storage property as "digital gold" may be more favored in the context of sovereign credit risks. ETH, with its robust ecosystem and deflationary mechanism (if EIP-1559 remains effective), as well as a potential ETF narrative (although not directly mentioning ETH ETF approval this time, previous information exists), may have the potential to outperform other assets in the late stage of a bull market (e.g., Arthur Hayes predicts ETH surpassing SOL).
◦ Targets Based on Market Sentiment: Analysts' year-end or 2025 BTC price targets ($220,000-$250,000) demonstrate a highly optimistic outlook for this bull market cycle, but this requires ongoing alignment of macro, regulatory, and internal market factors.
Core Logic:
On a macro level (US credit risk exposure → loose policy expectations) + within crypto (regulatory clarification → sustained capital inflows), market confidence is strengthening, resonating with both hedging and speculative demands. BTC awaits a catalyst to break the all-time high (if successful), triggering capital rotation, kicking off altseason, and anticipating a summer market The depth of the mid-to-long-term bull market depends on the extent of macro liquidity release and regulatory framework maturity. The current market is at a crucial inflection point where macro "bad news" (US credit issues) may be interpreted by the market as "good news" for the crypto market (forcing looseness). Internal positive factors lay the foundation for this optimistic outlook. The summer will be a critical window to validate these expectations.
On-chain Long-term Insights:
1. Expectation of Loose Macro Pressure + Gradually Improving Regulation Continuous ETF Fund Inflow;
2. Strengthened Market Confidence Continued Tightening of On-chain Supply (HODLer Hodling, Illiquidity Long-term Whales Increasing) Market Participants Generally in Profit (Price Far Above LTH and STH Costs);
3. Minimal Selling Pressure Whale Behavior Stable, Market Risk Controllable BTC Has Upward Momentum;
4. Waiting for Catalyst Breakout to New High (If Successful) Triggering Altcoin Season Rotation;
5. Summer Rally is Worth Expecting Mid-term Bull Market Depth Depends on Macro Liquidity and Regulatory Maturity, STH Cost Line is a Key Short-term Reference.
• Market Tone: The on-chain data of this round further strengthened the market's bullish logic, especially the STH Cost Chart, clearly showing the healthy structure and strong support of the current bull market. The market is to some extent ready, only lacking the "east wind" (key catalyst).
On-chain Mid-term Probe:
1. Increase in Long-term Chip Ratio compresses short-term sell-off space, market resilience strengthens, price breakthrough requires new supply push.
2. Liquidity volume maintains a healthy level, continuous support from new supply, current price may continue in a range-bound pattern.
3. Whales continue to accumulate at low levels but no concentrated selling pressure, the market is still in a mild accumulation phase, with no trend reversal formed.
4. Exchange platform ETH circulation shrinks, funds concentrate in BTC for hedging, small coins may face liquidity siphon-induced selling pressure.
5. BTC short-term profit-taking accumulation forms selling pressure, price upward space constrained by profit-taking demand.
• Market Tone:
Hesitation, Oscillation
BTC Maintains Centralized Oscillation, Structural Differentiation Intensifies, Caution is Needed for Small Coin Liquidity Risk.
On-chain Short-term Observations:
1. Risk Factor is in the Red Zone, Derivative Risk is High.
2. New Active Addresses are at a low level.
3. Market Sentiment Status Rating: Neutral.
4. Exchange Net Inflows of BTC and ETH are in a continuous large outflow state.
5. Global Buying Power Slightly Rebounds compared to last week, Stablecoin Buying Power Slightly Decreases.
6. The Probability of Not Breaking Below 95000~100000 in the Short Term is 80%;
• Market Outlook: In the short term, there are fewer profit-taking chips at the current price level, and buying power is sufficient to support it. Although the market is in a state of "divergence" with positive sentiment and prices, due to the accumulation in the derivatives market, rapid market fluctuations are expected soon. The outlook for this week is similar to last week, with still a possibility of further short squeezing, but the likelihood of a direct sharp pullback is low.
Risk Warning: The above is all market discussion and exploration and does not provide directional views for investment; please handle with caution and be aware of and prevent market black swan risks.
This article is a contributed submission and does not represent the views of BlockBeats.
Disclaimer: The content of this article solely reflects the author's opinion and does not represent the platform in any capacity. This article is not intended to serve as a reference for making investment decisions.
You may also like
CandyBomb x POWER: Trade to share 4,387,500 POWER
New users get a 100 USDT margin gift—Trade to earn up to 1888 USDT!
Bitget Spot Margin Announcement on Suspension of DOG/USDT, ORDER/USDT, BSV/USDT, STETH/USDT Margin Trading Services
BGB holders' Christmas and New Year carnival: Buy 1 BGB and win up to 2026 BGB!