Week 18 On-Chain Data: Macro Warmth and On-Chain Strong Signals, the Logic Chain and Outlook of BTC's "Summer Offensive"

The current market sentiment, even in the face of ongoing short selling, has not entered the "FOMO" zone and is still in the neutral range.
Original Title: "Macro Warm Wind and On-chain Strong Signal: The Logic Chain and Outlook of BTC's 'Summer Offensive' | WTR 5.12"
Original Source: WTR Research Institute
Weekly Review
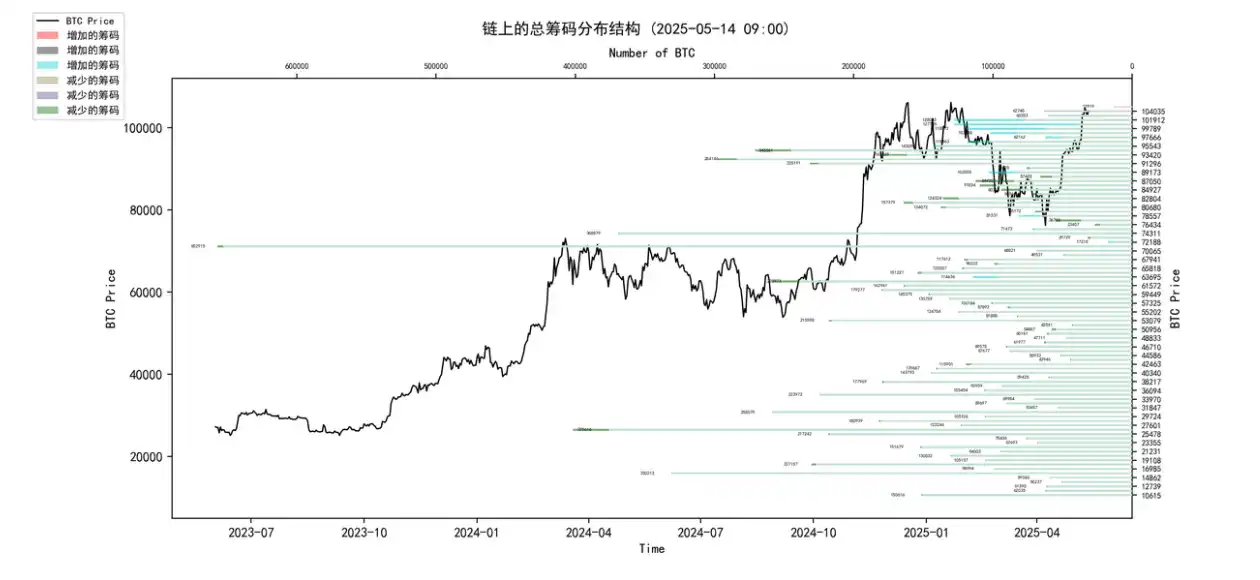
This week, from May 5th to May 12th, Bitcoin's highest point was near $105,819, and the lowest point was close to $93,514, with a fluctuation range of about 13.16%. Observing the chip distribution chart, there was a large volume of chips traded around 93,000, providing some support or pressure.
• Analysis:
1. 60000-68000: approximately 1.22 million coins;
2. 76000-89000: approximately 1.1094 million coins;
3. 90000-100000: approximately 1.57 million coins;
• The probability of not breaking below 95,000 to 100,000 in the short term is 80%;
Important News Aspect
Economic News Aspect
1. International Trade and Tariffs:
◦ US-UK Tariff Agreement: Last week, the US and UK reached a tariff agreement.
◦ Ongoing Economic and Trade Talks (US-China Consensus): This week, in the ongoing economic and trade talks, China and the US reached an important consensus. Subsequent focus will be on tariff agreements between the US and Japan, South Korea, and other economies. The market has recovered from the decline caused by previous tariff negative news.
◦ Progress in Economic and Trade Talks (12th-day News): Both sides reached an important consensus in trade talks, making substantive progress. Retaining 10% tariffs, canceling or suspending other additional tariffs. This positive outcome provides a stable signal to the market, stabilizes the international trade environment, reduces global asset market risk aversion sentiment, and has a positive impact on the economic outlook. The US side stated that the differences were not significant, and the agreement was reached quickly.
◦ Softening of Trump's Attitude (mentioned): After "Trump's attitude softened," the market recovered from the decline. Looking ahead to a "window of Trump tariff softening transition."
2. Federal Reserve Policy:
◦ Slower Balance Sheet Reduction: The Fed's balance sheet shrank by $17 billion last month to $6.7 trillion (the lowest since April 2020). In March, the Fed announced that the pace of quantitative tightening (QT) would slow from $60 billion per month to $40 billion per month on average, indicating a slower pace of balance sheet reduction.
◦ Rate Cut Expectation: Inflation data (CPI) will directly impact the Fed's rate cut timing. The market expects the end of the U.S. quantitative tightening (QT) and the beginning of rate cuts. The market anticipates a recovery from the previous drop caused by the pause in rate cuts during the summer.
3. Inflation Data:
◦ U.S. CPI Release: The U.S. will release CPI data on Tuesday, with a previous value of 2.4% and an expected value of 2.4%.
Crypto Ecosystem News
1. SEC Developments and Regulation:
◦ Tokenization Roundtable: On the 12th, the SEC held a roundtable discussion titled "Tokenization: Moving Assets Onchain: Where TradFi and DeFi Meet." Participants included SEC officials, the head of the Crypto Assets Task Force, Commissioner Hester Peirce, as well as representatives from Fidelity, Nasdaq, Invesco (Will Geyer), and other institutions.
◦ Fidelity's Meeting with the SEC (ETH ETF): Fidelity met with the SEC last Friday to discuss issues related to a crypto ETF's collateralization and options.
◦ New SEC Chair Expectations: The market expects the new SEC chair to bring breakthroughs in tokenization and collateralization legislation.
2. U.S. Government Holdings:
Arkham data shows that the U.S. government's cryptocurrency holdings have reached a value of $21.56 billion, including:
▪ 198,012 BTC (valued at approximately $20.69 billion)
▪ 59,965 ETH (valued at approximately $1.507 billion)
▪ $122 million in stablecoins
3. Analyst Insights and Market Forecasts:
◦ Moustache: The current market structure resembles that of 2016 and 2020, and the altcoin season for 2025 has officially begun.
◦ Hank Huang (Kronos Research CEO): The crypto market is riding the global optimism rebound, with ETH's strong recovery driving the altcoin market. Observers are focusing on whether funds can effectively rotate from BTC to altcoins and meme coins.
◦ Min Jung (Presto Research Analyst): The recent market uptrend is being driven by optimism in trade negotiations. The possibility of BTC breaking its all-time high depends on the progress of the negotiations. BTC's dominance is at a plateau not seen since the bull market of 2021, undergoing a typical rotation as capital flows into altcoins.
◦ Rekt Fencer: Irony Season, believing the recent around 10% bounce is easily overinterpreted, BTC dominance still above the 54% key threshold, institutional BTC preference likely to continue influencing fund flows.
◦ Rekt Capital: BTC is on the verge of initiating the second leg of price discovery to the upside, needs to hold the $104,500 support, reclaiming the upper boundary of the recent accumulation range is crucial.
◦ Josh Gilbert (eToro Analyst): Market sentiment shifting towards risk-on, easing of tensions. Mention of "Trump willing to negotiate" helps boost risk-on asset (especially BTC) sentiment. Market reignites optimistic sentiment.
◦ Trend Research: Predicts ETH will reach $5,000 this cycle, based on the end and rate cuts of the US QT, new SEC chair bringing breakthroughs in tokenization and staking legislation, ETH Foundation's infrastructure innovation, etc. In an optimistic scenario, if BTC breaks $300,000, ETH could rise to $10,000.
4. US BTC Spot ETF Fund Flow:
◦ Net inflow of $920 million last week (Grayscale GBTC outflow of $171.5 million, Fidelity FBTC inflow of $62.4 million, CI BIT inflow of $1.03 billion).
◦ As of last Friday, total net inflows of $40.806 billion, reaching a historical high, attracting $5.3 billion in the past three weeks, holdings surpassing 4.9 million BTC.
◦ US ETH Spot ETF Fund Flow: Outflow of $38.2 million last week.
◦ CI ETH ETF Application: CI filed an application to allow its ETH ETF to conduct physical redemptions, supporting direct ETH repurchases.
5. ETH Performance:
◦ 37.01% increase last week, marking the highest weekly gain in ETH history for Week 18, surpassing the 33.1% of the same period in 2021.
6. Institutional Purchases:
◦ MicroStrategy (Strategy): Acquired an additional 13,390 BTC from May 5th to 11th at an average price of $99,856 per BTC (totaling $1.34 billion).
◦ Coinbase (Cb): Added $153 million worth of cryptocurrency in the first quarter, holding $1.3 billion in crypto assets as of the reporting date, mostly in BTC.
Long-term Insights: Used to observe our long-term situation; Bull Market/Bear Market/Structural Change/Neutral State
Medium-term Investigation: Used to analyze what stage we are currently in, how long this stage will last, and what circumstances we will face
Short-term Observations: Used to analyze short-term market conditions; as well as the emergence of trends and the likelihood of certain events occurring under certain conditions
Long-term Insights
• Illiquid Long-term Whale
• Illiquid Long-term Whale
• BTC US Spot ETF Fund Flow
• Exchange Large Inflow-Outflow Net Position
• BTC Spot Total Sell Pressure Wind-down Risk Ratio
(See Illiquid Long-term Whale Chart Below)

• This ratio has recently remained at a high level and has shown a further upward trend in the latest data.
• This indicates that BTC held long-term in the market and not easily sold (illiquid supply) is still increasing, or its growth rate exceeds that of the overall supply. This is usually seen as a positive signal, representing strong confidence among whale HODLers, with potentially less selling pressure.
• Historical Comparison: Historically, a continuous increase in this indicator often accompanies a price increase or serves as a momentum builder for an increase.
• BTC price has risen synchronously with the increase in illiquid supply, showing strong support.
(See BTC US Spot ETF Fund Flow Chart Below)
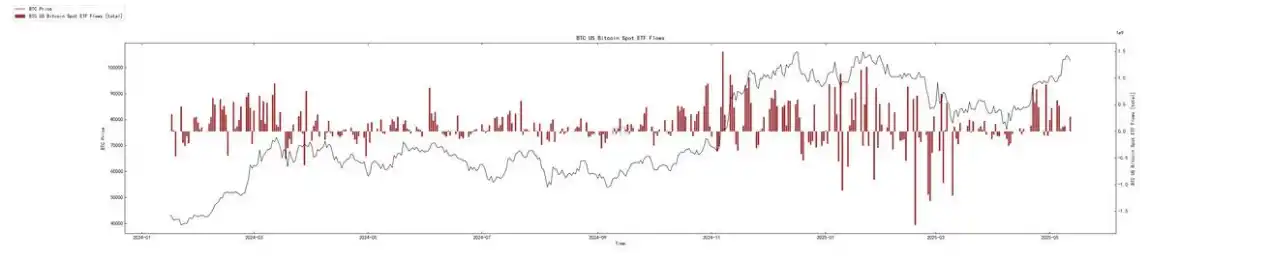
• After experiencing a period of slowed fund inflow or even brief outflows, the recent days (far right) show a clear net inflow recovery.
• Although the single-day inflow volume may not match the peak when the ETF was first launched, the sustained net inflows indicate that traditional financial market funds are still actively allocating to BTC.
• Historical Comparison: The significant inflow at the beginning of 2025 was a key driver of this round of the market. The recent recovery inflow has provided support and impetus to market confidence and prices.
(See Exchange Large Inflow-Outflow Net Position Chart Below)
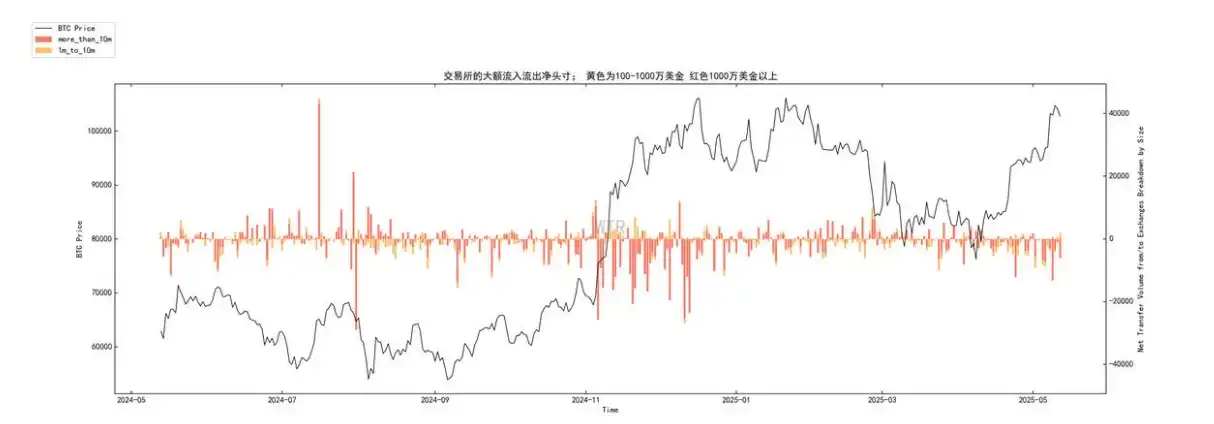
• Red Bar (> $10 million): After the price rose to a high level, there were intermittent net inflows (likely indicating some whales cashing out or risk managing), but not sustained large-scale outflows to exchanges. In recent days, there has even been a small amount of net outflow (negative red values).
• Orange Bar ($100-1000 million): The performance has been more mixed, but overall, during the price increase, there has not been a sustained large-scale net inflow. In recent days, there have also been outflows.
• Summary: Despite some signs of whale cashing out at the peak, a panic sell-off or a trend of large-scale transfer of BTC to exchanges for selling preparation has not formed. Instead, recently, there are signs of net outflows from large addresses to exchanges, which is usually interpreted as accumulation or transfer to long-term storage, a positive signal.
(BTC Spot Total Selling Pressure Risk Ratio Below)
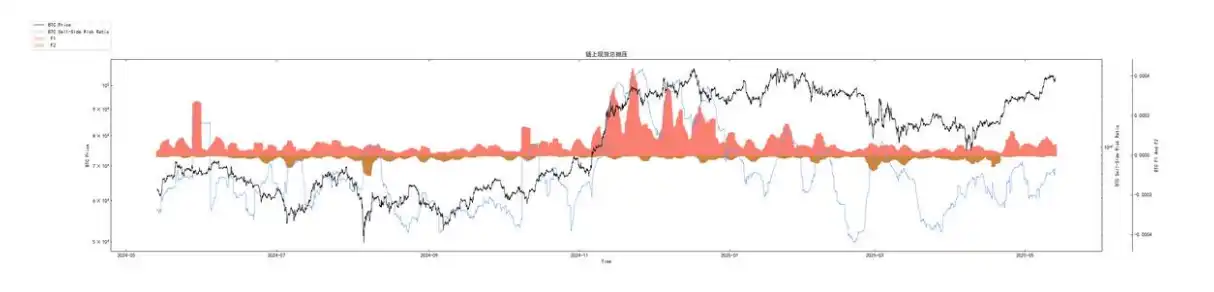
The ratio is currently at a relatively moderate low position. It is not in an extremely low "excellent buy zone," but far from the high-risk zone seen at historical bull market tops. During the recent price increase, this indicator has risen, but the increase has been moderate.
• Historical Comparison: Before the significant price increase from late 2023 to early 2024, this indicator was at a lower level. This indicator is very high at historical bull market tops.
• Currently, as the price rises, the sell-side risk ratio is moderately increasing, which aligns with the characteristics of a healthy bull market, indicating that the market has not accumulated too much short-term profit-taking pressure due to rapid price increases.
Combining macro and on-chain logic for reanalysis:
1. Starting Point: Macro Environment Improvement + ETF Narrative Drive (News Face and Chart 2)
◦ News Face: Fed QT slowdown, rate cut expectations, trade situation easing, and market risk preference increase.
◦ Chart 2 (ETF): The strong capital inflow into ETFs at the beginning of the year validates the traditional capital's demand for BTC allocation, which is a crucial foundation of this rally. Recent ETF inflows inject new momentum and confidence into the market.
◦ Analysis: Macro tailwinds + Structural demand (ETF) together lay the foundation for the bull market.
2. Follow-through: HODLer Confidence Strengthening and Supply Tightening (Chart 1)
◦ Chart 1 (Illiquid Long-term Whale): Against the backdrop of price increases and continuous ETF accumulation, the illiquid supply continues to increase, indicating that long-term investors (HODLers) have not only sold off significantly due to price increases but have strong hodling sentiment, even increasing their holdings. This has resulted in a tightening of the actual tradable supply.
◦ News Update: Institutions like MicroStrategy continue to increase their BTC holdings, aligning with the trend of increasing illiquid supply.
◦ Therefore: Strong HODLing behavior + continued ETF purchases leading to further reduction in available BTC for trading are causing a supply shock effect, providing significant price support.
3. Validation: Whale Behavior and Market Risk Assessment (Charts 3 and 4)
◦ Chart 3 (Large Transactions Platform Net Outflow): Despite the high price, large addresses are showing a recent trend of net outflows from the trading platforms, indicating that whales/institutions are still accumulating or moving BTC to cold wallets for long-term holding, rather than engaging in large-scale selling. This further strengthens the expectation of a supply shortage.
◦ Chart 4 (Spot Total Sell Pressure Risk Ratio): At a moderately low level, indicating that the market is not overheated yet, and the current uptrend has a degree of healthiness, not purely driven by short-term speculation.
◦ Chart 1 (Illiquid Long-Term Whales): Also indicates that the market is far from reaching a euphoric top.
◦ News Update: Analysts believe that BTC is on the verge of initiating the second leg of price discovery and must hold a key support level (such as $104,500). On-chain data demonstrates the solidity of this support.
◦ Therefore: Whale accumulation behavior and controllable market risk provide space and potential for further price upside. Market structure is relatively healthy.
4. Progressive Outlook: Rotation Expectations and New Catalysts (News Update)
◦ News Update: The market is monitoring the progress of an ETH ETF and the potential rotation of funds from BTC to altcoins. The decline in BTC dominance is seen as a signal of altcoin season.
◦ On-chain correlation: If BTC continues its strength and attracts more funds, when its price stabilizes or its momentum slows down, some funds seeking higher alpha may flow into ETH and other altcoins. This may be reflected in BTC-related on-chain metrics (such as a slowdown in the growth of illiquid long-term whales or an increase in short-term fund activity on trading platforms), but currently, BTC's fundamentals remain very strong.
◦ Summary: Currently, BTC still dominates the market absolutely. If macro and ETF fund flows continue to improve, BTC is likely to continue leading. The clear progress of an ETH ETF will be the next important market catalyst and observation point.
Future Outlook:
Medium-Term Outlook:
◦ High Probability of BTC's Continued Strength: Given the strong growth of illiquid long-term whales, renewed ETF fund inflows, signs of whale accumulation, and the not yet overheated spot total sell pressure risk indicator, the BTC price is expected to continue its upward trend, possibly even challenging previous highs. Holding the mentioned $104,500 support level, as discussed in the news, will be a crucial signal.
◦ Focus on ETF Fund Flow Sustainability: It is crucial to assess whether ETF funds can maintain stable net inflows, as illustrated in the recent trend in Figure 2. If there is a prolonged period of significant net outflows, caution should be taken as a retracement risk may emerge.
◦ Macro Data Impact: Key macro events such as CPI releases and the Federal Reserve interest rate meetings will continue to drive market volatility. Inflation data meeting expectations and dovish signals could further boost market sentiment.
◦ ETH ETF Progress: Any substantial positive developments regarding an ETH ETF could trigger early enthusiasm in the market for ETH and its ecosystem, potentially diverting some short-term capital attention from BTC. However, in the long run, this is favorable for the entire crypto market.
Medium-Term Outlook:
◦ Bull Market Deepening Phase: The current on-chain data characteristics (rising early-stage large whale illiquidity, manageable risk) align with the transition from the early stage to the mid-stage of a bull market. If the macro environment continues to improve (such as the Fed initiating a rate-cut cycle) and with the increasing penetration of compliant channels like ETFs, the bull market may deepen further.
◦ Price Discovery and Intensified Volatility: As prices continue to reach new highs, market volatility may escalate. It is essential to closely monitor the illiquid long-term whales in Figure 1 and the spot total selling pressure risk ratio in Figure 4. If they rapidly approach historical top zones, market risk surges sharply, necessitating caution against potential temporary tops or significant pullbacks.
◦ Long-Term Impact of Tokenization and Regulation: Regulatory focus on tokenization by entities like the SEC and potential policy breakthroughs under new leadership are long-term positives. Achieving compliant and scalable on-chain asset tokenization could unlock significant growth potential for the crypto market.
◦ Altseason Arrival: The likelihood of a large-scale capital rotation to altcoins in an "altseason" increases when BTC's uptrend stabilizes or enters a consolidation phase at high levels, especially post events like the ETH ETF. At that time, monitoring BTC's market dominance will be crucial.
Mid-Term Exploration
• Liquidity Supply Volume
• Price Level Cost Structure
• USDC Buying Power Composite Score
• Whale Composite Score
• Incremental Model
• Settlement Structure
(See the following chart on Liquidity Supply Volume)
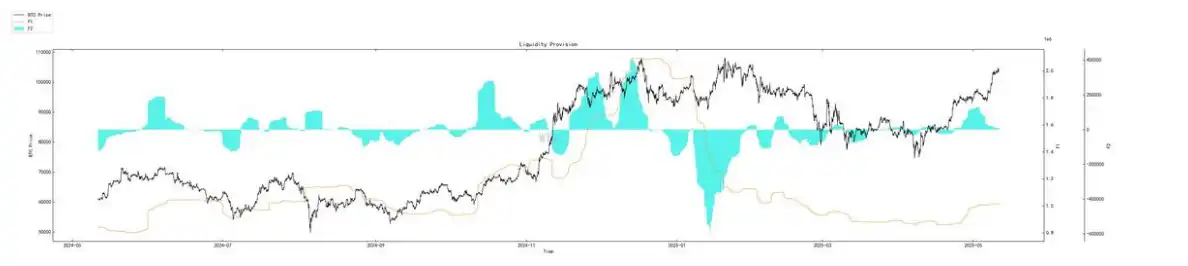
Currently, the liquidity supply volume is showing signs of decline and reduction. The recent market uptrend may be a low-volume rally and not a sustainable trend in a stock-constrained environment.
(Chart below shows Price Level Structure)
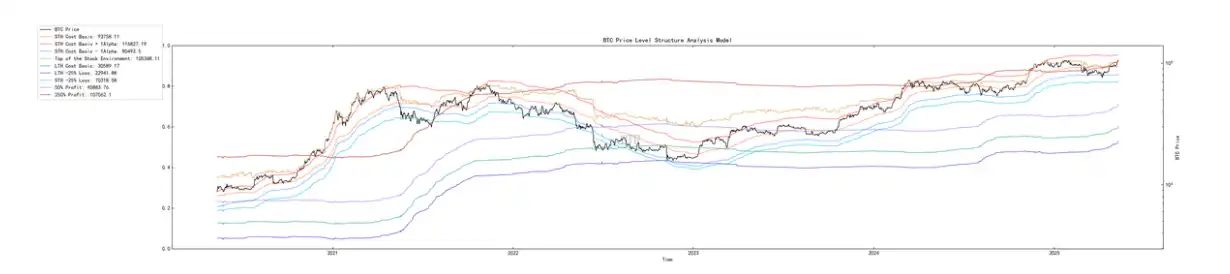
The market's stock level top around 105,000 is facing a stock limit dilemma. If there is no significant subsequent incremental supply, the market may cap at this price level. At the same time, if the market still maintains a stock structure, the market may undergo high-intensity turmoil between 80,000 and 105,000. Of course, the range provided is a rough calculation of the price range supported by market liquidity. If there is an incremental market, emotional squeeze pullback, or deep liquidation leverage, it may break this range.
(Chart below shows USDC Buying Power Composite Score)
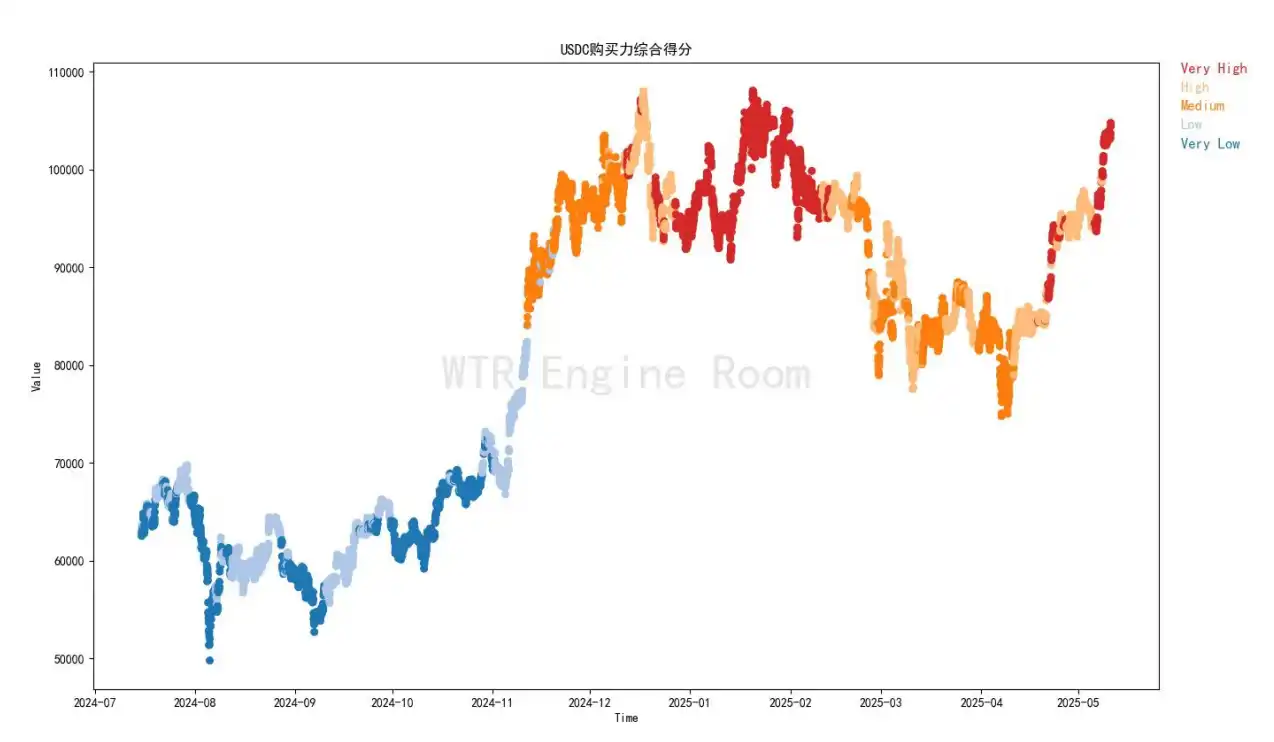
The current USDC fund still has a high buying power, possibly providing residual liquidity support for market pricing in the short term.
(Chart below shows Whale Composite Score)
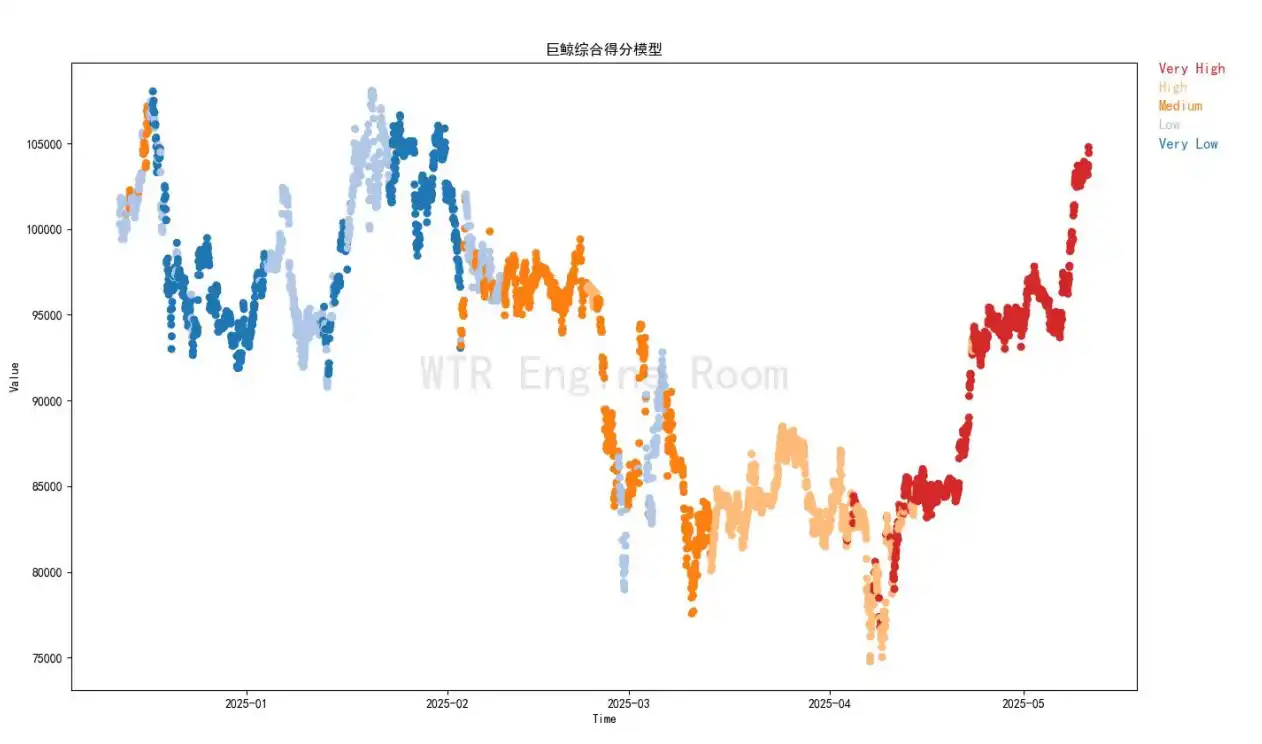
The whales' buying power level remains at a high level; there is currently no overall whale shakeup or divergence in the market.
(Chart below shows Incremental Model)
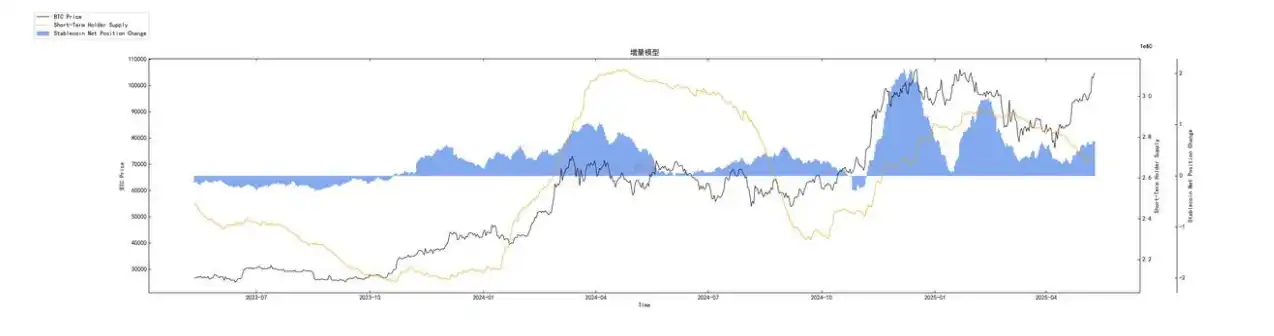
The current incremental fund's supply power is insufficient; the market may need to grow, or the current incremental funds may not intend to chase the rise excessively.
(Chart below shows Liquidation Structure)
The market is transitioning from a short liquidation structure to a long liquidation structure. If the market lacks incremental fund supply, there may be significant fluctuations in the coming period.
Short-term Observations
• Derivative Risk Factor
• Options Intent-To-Trade Ratio
• Derivative Trading Volume
• Options Implied Volatility
• Profit and Loss Transfer Amount
• New Addresses and Active Addresses
• Sugar Orange Exchange Net Inflow
• Auntie Exchange Net Inflow
• Heavy Selling Pressure
• Global Buying Power Status
• Stablecoin Exchange Net Inflow
• Off-Chain Exchange Data
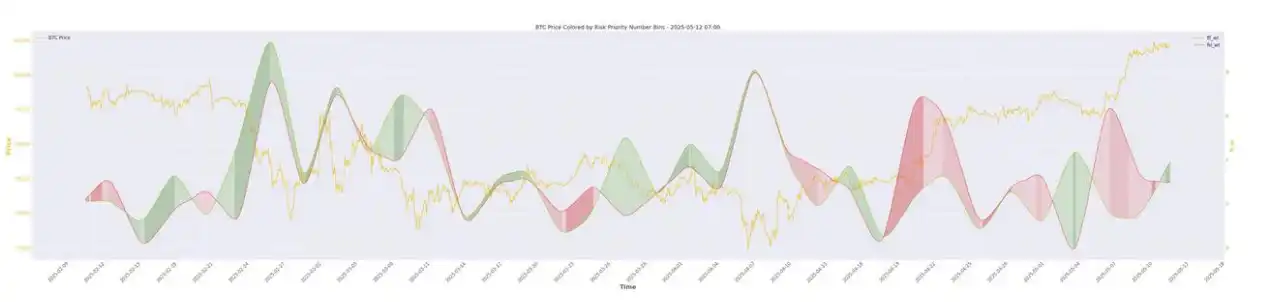
Derivative Risk Rating: The risk factor is in the red zone, indicating a high derivative risk.
(See Derivative Risk Factor Chart Below)
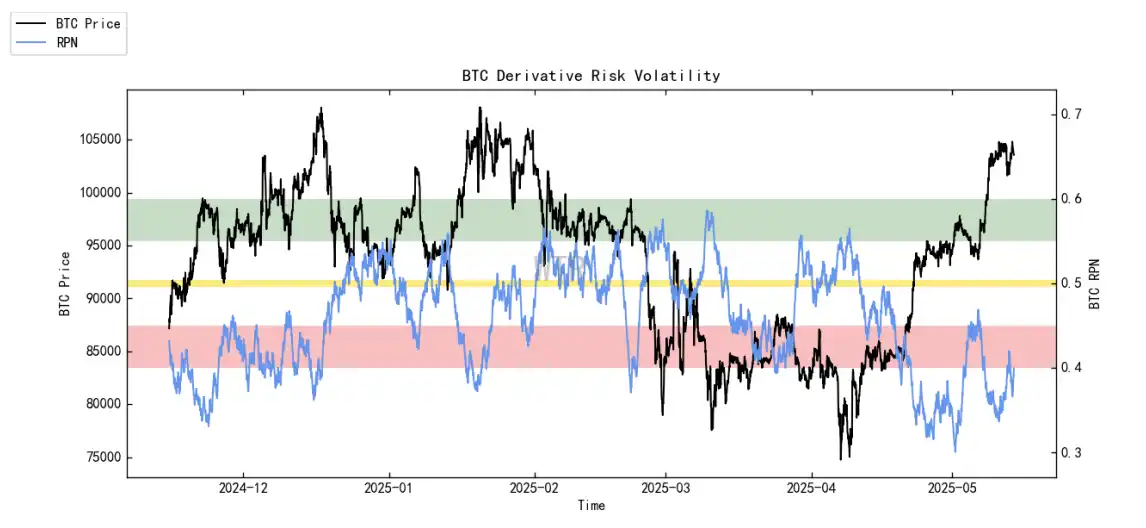
The risk factor has re-entered the red zone due to continued market shorting, but the intensity of shorting has slightly decreased compared to last week.
(See Options Intent-to-Trade Ratio Chart Below)
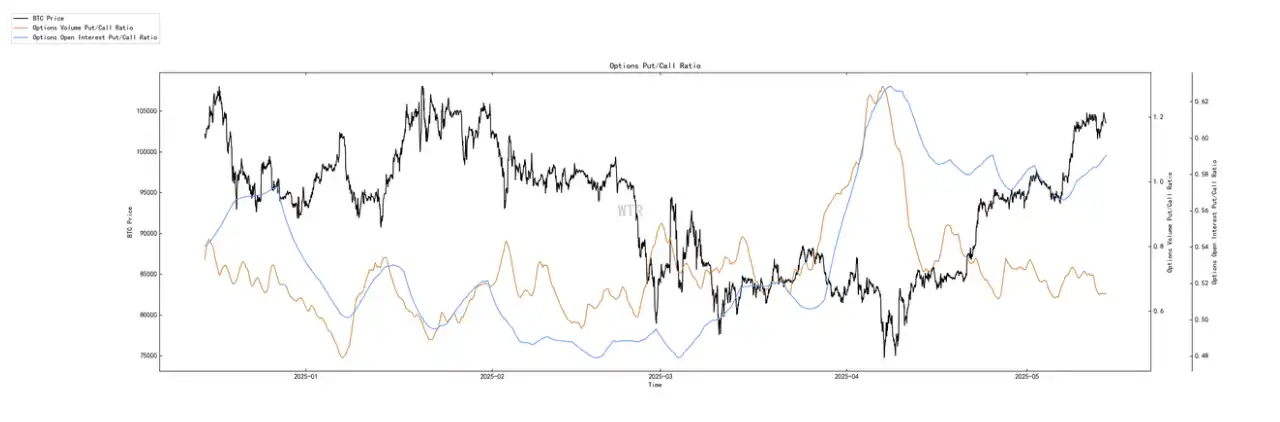
The ratio of put options has slightly increased, with trading volume remaining stable compared to last week.
(See Derivatives Trading Volume Chart Below)
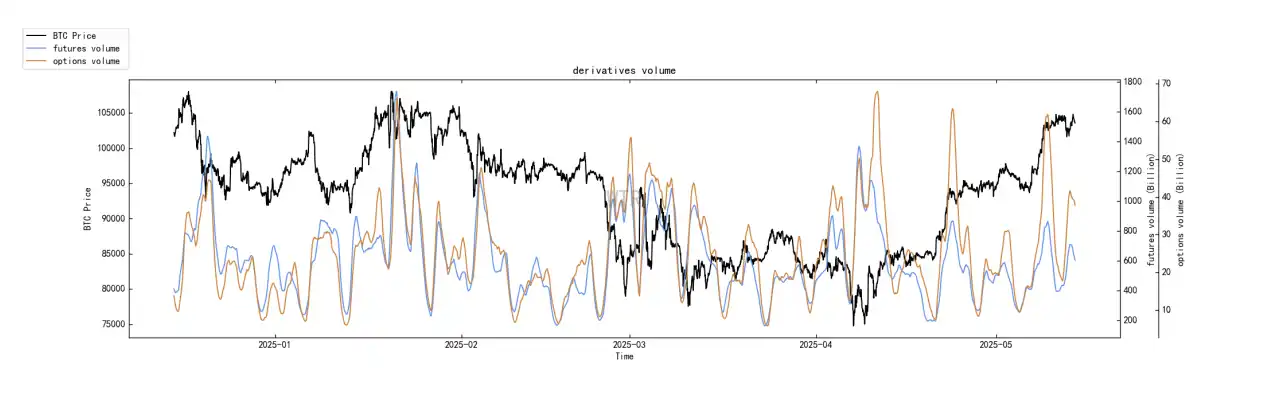
Derivatives trading volume is at a moderate level.
(See Options Implied Volatility Chart Below)
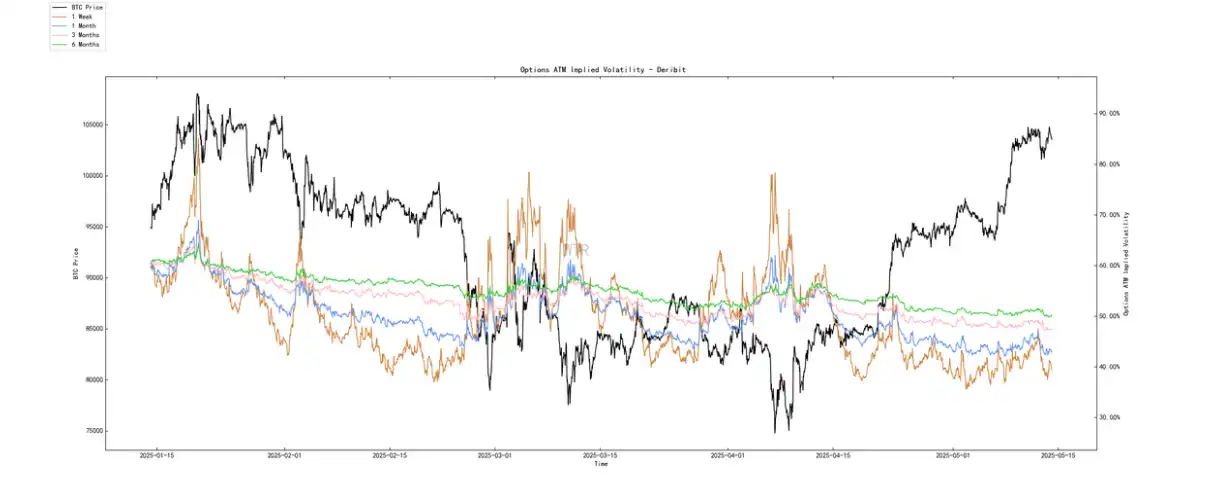
Options implied volatility has shown only minor fluctuations in the short term.
Sentiment Status Rating: Neutral
(See Profit-Loss Transfer Amount Chart Below)
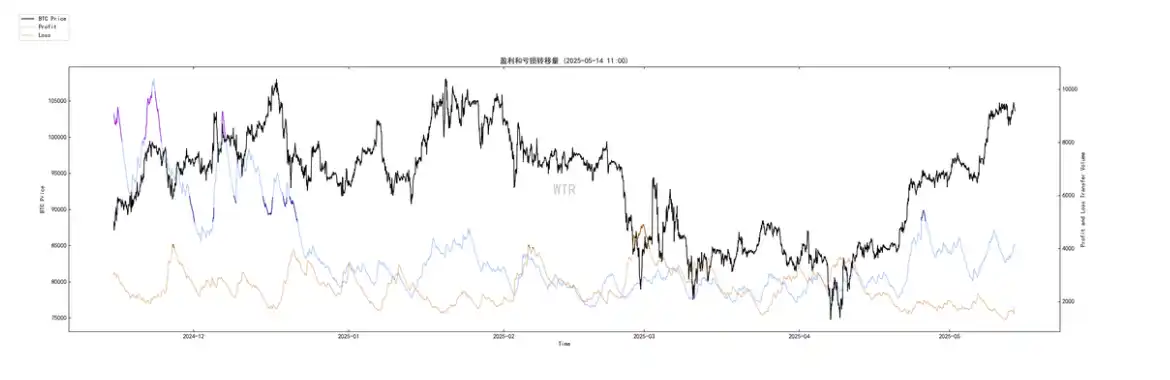
Despite the ongoing shorting in the market, the overall market sentiment has not risen continuously to enter a state of frenzy.
(See New Addresses and Active Addresses Chart Below)
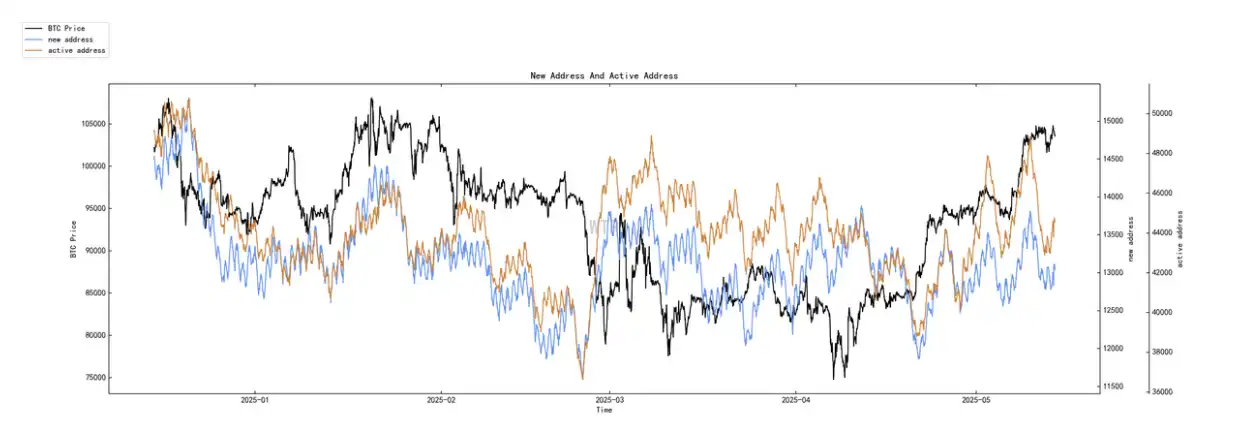
New active addresses are at a moderate level.
Spot Market and Selling Pressure Structure Rating: BTC and ETH are experiencing continued significant outflows.
(See Sugar Orange Exchange Net Inflow Chart Below)

Current BTC continues to experience large outflows.
(Net Headroom of E-Tai Transactions in the following image)
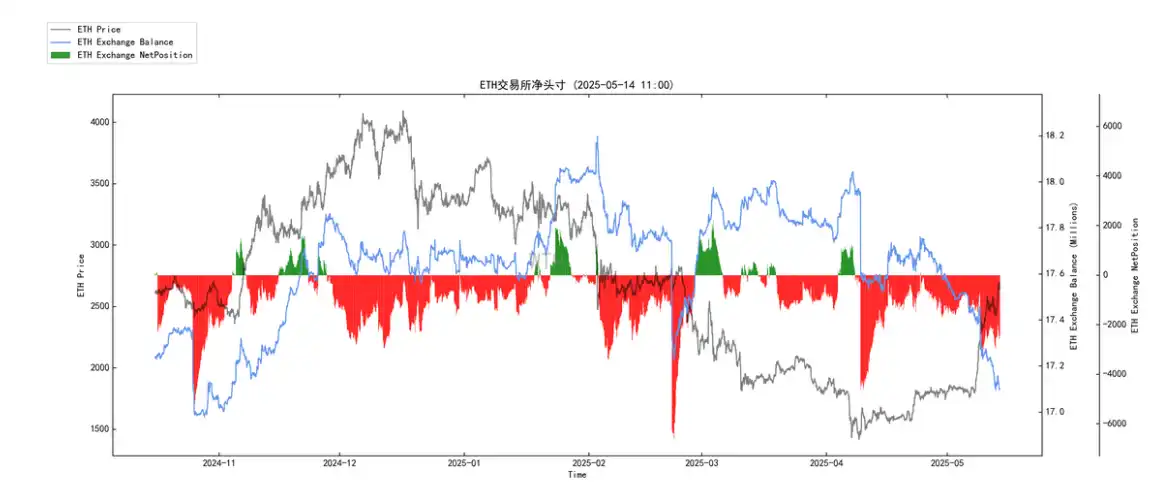
Current ETH continues to experience large outflows.
(High Weighted Sell Pressure in the following image)
There is a small amount of high weighted sell pressure, but it has currently eased.
Buy Power Rating: Global buy power has seen a significant rebound, and stablecoin buy power remains largely consistent with last week.
(Global Buy Power Status in the following image)
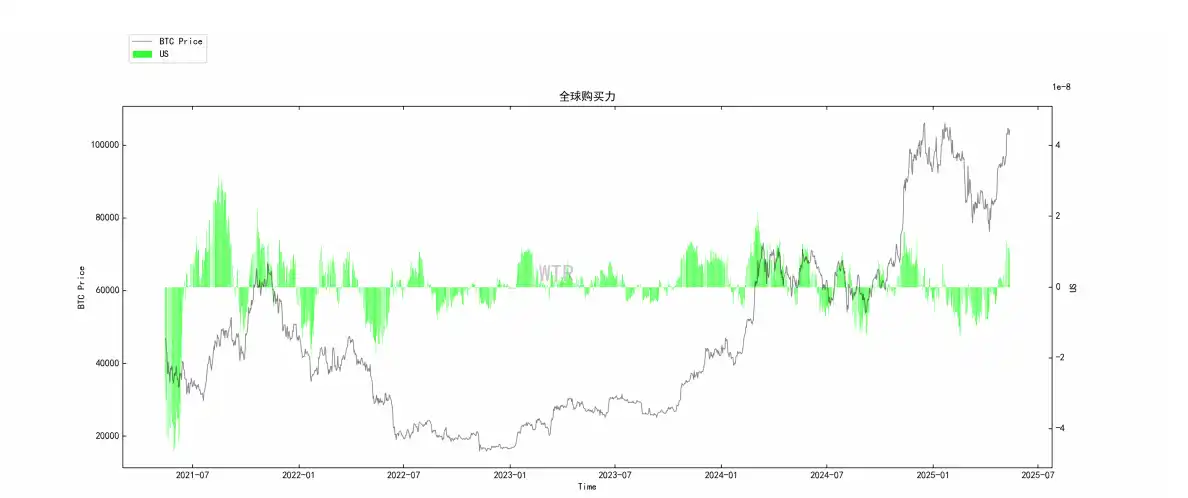
Global buy power has once again seen a significant rebound.
(Net Headroom of USDT Transactions in the following image)
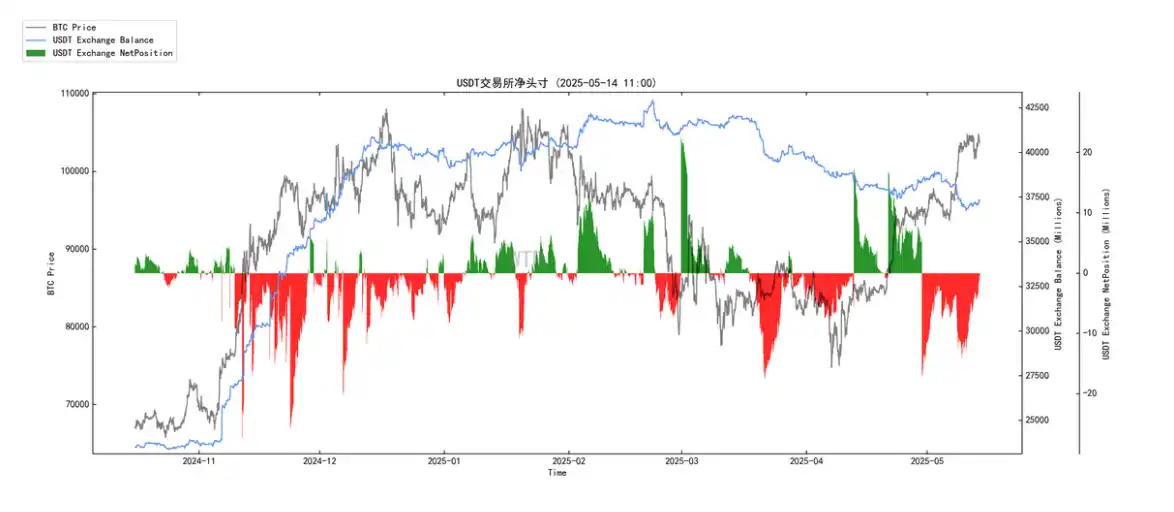
Overall stablecoin buy power remains consistent with last week.
Off-chain transaction data rating: This week, the website experienced technical difficulties, and there is currently no off-chain transaction data available.
Weekly Summary:
News Analysis and Summary:
Short-term:
CPI data is key: If inflation data remains moderate or decreases, it will solidify the market's expectation of a Fed rate cut, benefiting risk assets. The crypto market is likely to see continued upward momentum. Conversely, a different scenario could bring short-term pullback pressure.
BTC may continue its volatile rise, but with increased volatility: After digesting the positive ETF news, new large-scale incremental funding may require clearer macro signals (such as the first rate cut). $10,450 is a key observation level.
ETH ETF news will drive ETH and some altcoin sentiments: Any positive or negative news about ETH ETF could trigger significant market swings. Grayscale's actions are worth keen attention.
Medium-term:
The "Summer Window Period" is a key focus: The market generally expects the summer to bring a substantial shift in Fed policy (such as a clear rate cut path) and further clarity on tariff policies. If both turn out favorably, it will provide strong macro support for the crypto market.
The Fate of ETH ETF: If approved, it is expected to drive ETH and related altcoins to break out independently, forming a scenario of "BTC setting the stage, ETH performing, altcoin frenzy." The $5000 target for ETH is not far-fetched under optimistic sentiment.
Smoothness of Capital Rotation: Whether BTC's dominance can continue to decline, and whether capital will flow massively into altcoins as expected, are key factors determining whether the altcoin season can fully erupt. Caution is needed against "false breakouts" and the flight of capital after some hot topics.
Long-Term:
The Potential of Tokenization and On-chain Assets: The SEC's roundtable is just the beginning. If a favorable regulatory framework can be established, the tokenization of traditional assets will bring trillion-dollar incremental space to the crypto market.
The Unchanged Trend of Institutional Entry: Despite a temporary slowdown in pace, the trend of traditional financial institutions allocating to crypto assets (especially BTC and ETH) is expected to continue.
Regulatory Clarity is a Major Driving Force: Clear regulation will reduce uncertainty, attract more conservative capital, and drive industry innovation.
In summary: The current market sentiment is skewed towards optimism, mainly driven by macroeconomic expectations and the successful attraction of capital by the BTC ETF. The ETH ETF is the next core narrative. However, market volatility remains high (and depends on the satisfaction of multiple conditions such as CPI data, actual actions by the Federal Reserve, ETF approvals, etc.). It is necessary to remain rational, beware of "overinterpreting" short-term rebounds, and focus on key changes in capital flows and market structure, especially in altcoin selection, where fundamentals and narratives will be more prominent.
On-chain Long-term Insights:
1. Macro improvements + ETF structural demand bolster whale HODLer confidence;
2. Continued rise in illiquid supply supports large-scale capital inflows, keeping market selling pressure in check;
3. Healthy on-chain metrics provide a solid foundation for BTC's price uptrend (in the future), with new catalysts such as the ETH ETF poised to take over, leading the bull market to further development;
4. Beware of the rapid rise in mid-term on-chain risk data.
• Market Tune:
Currently, various on-chain metrics and news collectively point to a positive market environment, with BTC as the leading role remaining stable.
Currently, whether the positive trend can continue will be crucial, with on-chain, macro, and regulatory signals continuously releasing positive signals.
On-chain Mid-term Exploration:
1. Liquidity Decay, Difficulty Sustaining Volume-Led Growth.
2. Stock Limit around 105,000, Insufficient Incremental Supply Leading to Range-bound Trading.
3. Short-term USDC Buying Power Still Supporting Market Pricing.
4. Whale Buying Power Unshaken, No Signs of Divergence.
5. Insufficient Incremental Capital Inflow, Lack of FOMO.
6. Market Shifting to a Long Liquidation Structure, Lack of Incremental Flow Might Exacerbate Volatility.
• Market Adjustment:
Key Price Levels, Intense Game Theory
Around 105,000 is the BTC stock top area.
From a derivatives perspective, it has entered the tail end of a short liquidation cascade.
After the "short fuel" is exhausted, new capital needs to be injected to ensure healthy BTC transactions, thereby breaking through the stock limit.
If BTC pricing is stuck around 105,000, it may be due to excessive on-chain profits leading to a lack of capital absorption at the peak.
Short-term On-chain Observations:
1. The Risk Index is in the red zone, with a high derivative risk.
2. New active addresses are at a median level.
3. Market sentiment status rating: Neutral.
4. Exchange platform net flows of BTC and ETH are consistently high.
5. Global buying power is rebounding, stablecoin buying power is basically unchanged from last week.
6. The probability of not breaking below 95,000 to 100,000 in the short term is 80%.
• Market Adjustment:
Even in the face of sustained shorting, the current market sentiment has not entered the "frenzy" zone, still in a neutral range. Overall, considering the data observations, there is initial divergence at the current price levels, but there is still a possibility of further shorting, with a low probability of retracement.
Risk Warning: The above is all market discussion and exploration, not investment advice; please treat with caution and guard against market black swan risks.
This article is contributed content and does not represent the views of BlockBeats.
Disclaimer: The content of this article solely reflects the author's opinion and does not represent the platform in any capacity. This article is not intended to serve as a reference for making investment decisions.
You may also like
Mastercard and MoonPay Partnership: A Game-Changer for Stablecoins and Crypto Adoption
DOJ Will Still Pursue Roman Storm Case Despite Blanche Memo, Prosecutors Say
DOJ Targets $263 Million Theft Ring and Tornado Cash Co-Founder
Cardano joins Brave browser