
XRP Could Potentially Fall Below $2 as Bearish Indicators Intensify

XRP is showing signs of technical strain, with bearish indicators flashing across RSI, Ichimoku Cloud, and EMA charts. The next few days may be pivotal.
XRP is under pressure, down nearly 7% over the past week. However, its 24-hour trading volume has surged nearly 52%, reaching $2.3 billion, indicating elevated activity around the altcoin.
Multiple technical indicators point to a bearish outlook, including a weakening RSI, a fully bearish Ichimoku Cloud setup, and a looming death cross in the EMA lines. With sentiment fragile and key levels in play, XRP’s next move will likely hinge on whether buyers step in or momentum continues to erode.
XRP RSI Drops to 36.97: Is a Reversal Coming?
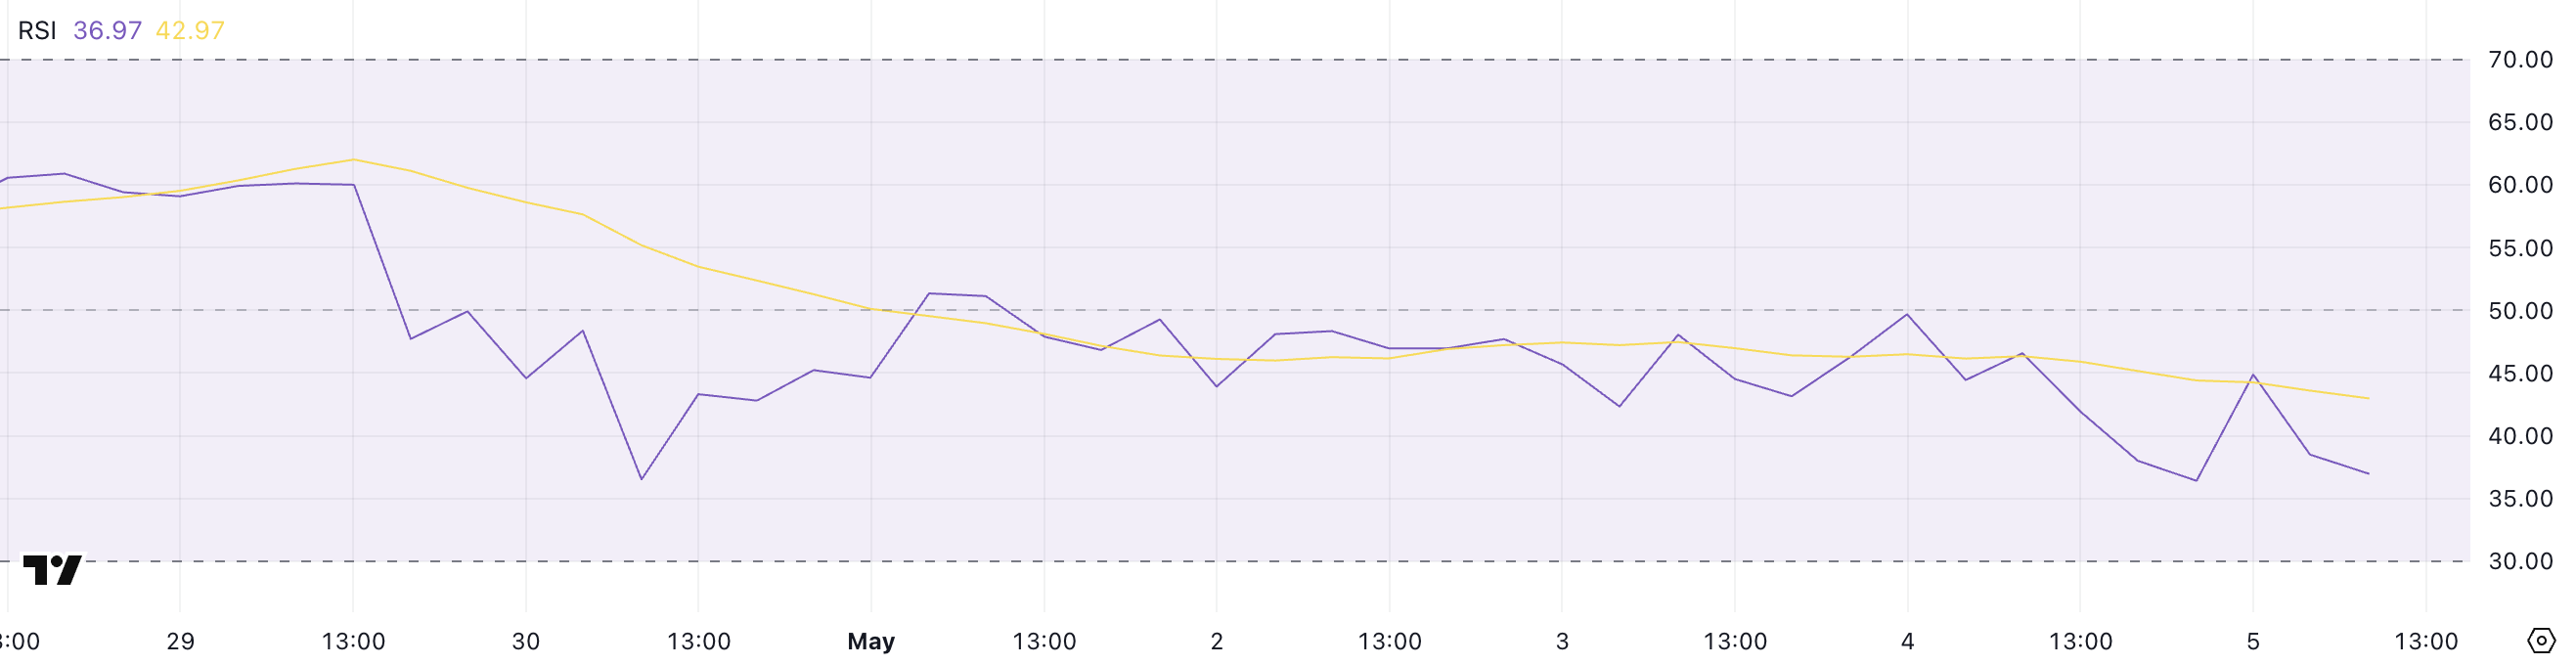
XRP’s Relative Strength Index (RSI) has dropped sharply to 36.97, down from 49.68 one day ago. This decline suggests a clear loss of momentum, with the indicator now approaching oversold territory.
The RSI is a widely used momentum indicator that ranges from 0 to 100. It helps traders identify potential reversal zones.
Readings above 70 typically indicate an asset is overbought and may face a pullback, while readings below 30 suggest it may be oversold and primed for a bounce.
 XRP RSI. Source:
TradingView.
XRP RSI. Source:
TradingView.
With XRP’s RSI now at 36.97, it is edging closer to the oversold threshold but hasn’t reached it yet. This level signals weakening buying pressure and could mean further downside in the short term if selling continues.
However, if the RSI drops below 30 and stabilizes, it may trigger buying interest from traders anticipating a rebound.
For now, XRP is in a caution zone—neither strongly oversold nor neutral—suggesting that price action in the next few days will be crucial in determining its short-term direction.
Ichimoku Signals Downtrend for XRP with Clear Cloud Resistance
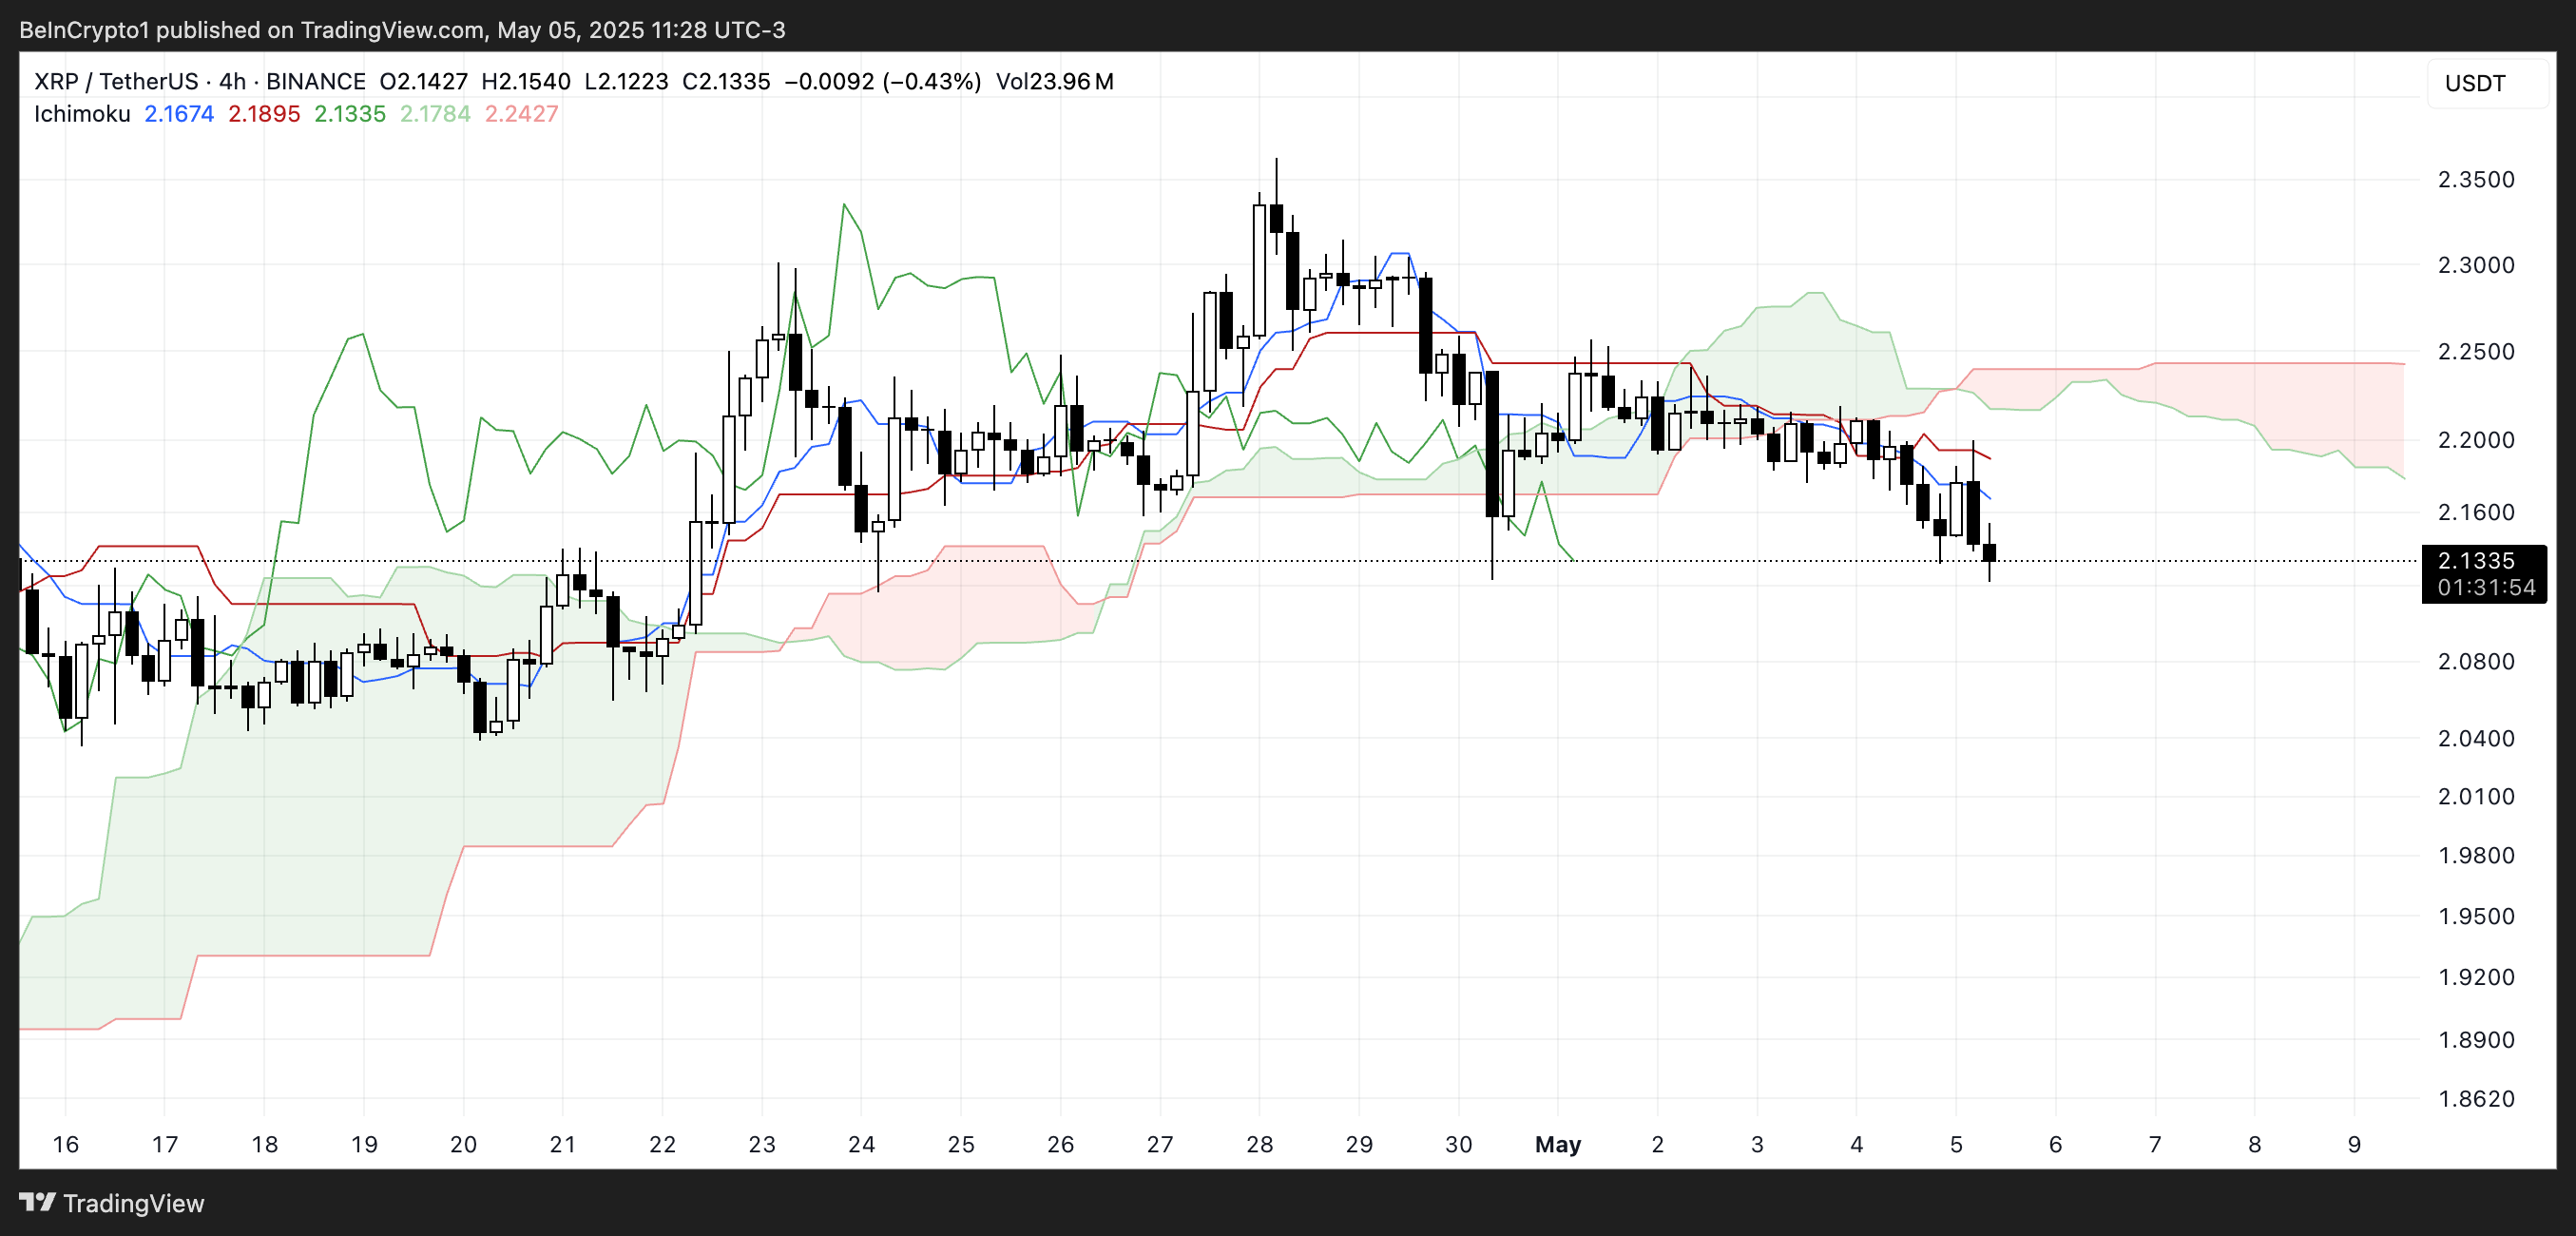
The Ichimoku Cloud chart for XRP reveals a decisively bearish structure across all key components. The price is positioned below the Tenkan-sen (blue line) and the Kijun-sen (red line), indicating that short-term and medium-term momentum are aligned to the downside.
This configuration typically suggests ongoing selling pressure with no clear signs of reversal in the immediate term. Furthermore, the Chikou Span (green lagging line) is trailing well below the current price and the cloud, reinforcing a strong bearish sentiment from a momentum standpoint.
This alignment of elements indicates that XRP remains under downward pressure, with buyers unable to regain control of the trend.
 XRP Ichimoku Cloud. Source:
TradingView.
XRP Ichimoku Cloud. Source:
TradingView.
The Kumo (cloud), representing future support and resistance, has turned red and is projected downward—another bearish signal. The price being well below the cloud confirms that XRP is in a fully bearish phase under Ichimoku analysis.
Additionally, the gap between the Senkou Span A and B lines (the edges of the cloud) is widening slightly, which suggests that bearish momentum may still be strengthening rather than fading. To shift the outlook, XRP first must break above the Kijun-sen and eventually push into the cloud, neutralizing bearish momentum.
Until then, the technical outlook remains weak, and traders may remain cautious unless a clear bullish reversal pattern emerges.
XRP Outlook: Death Cross Looms, Resistance Levels in Focus
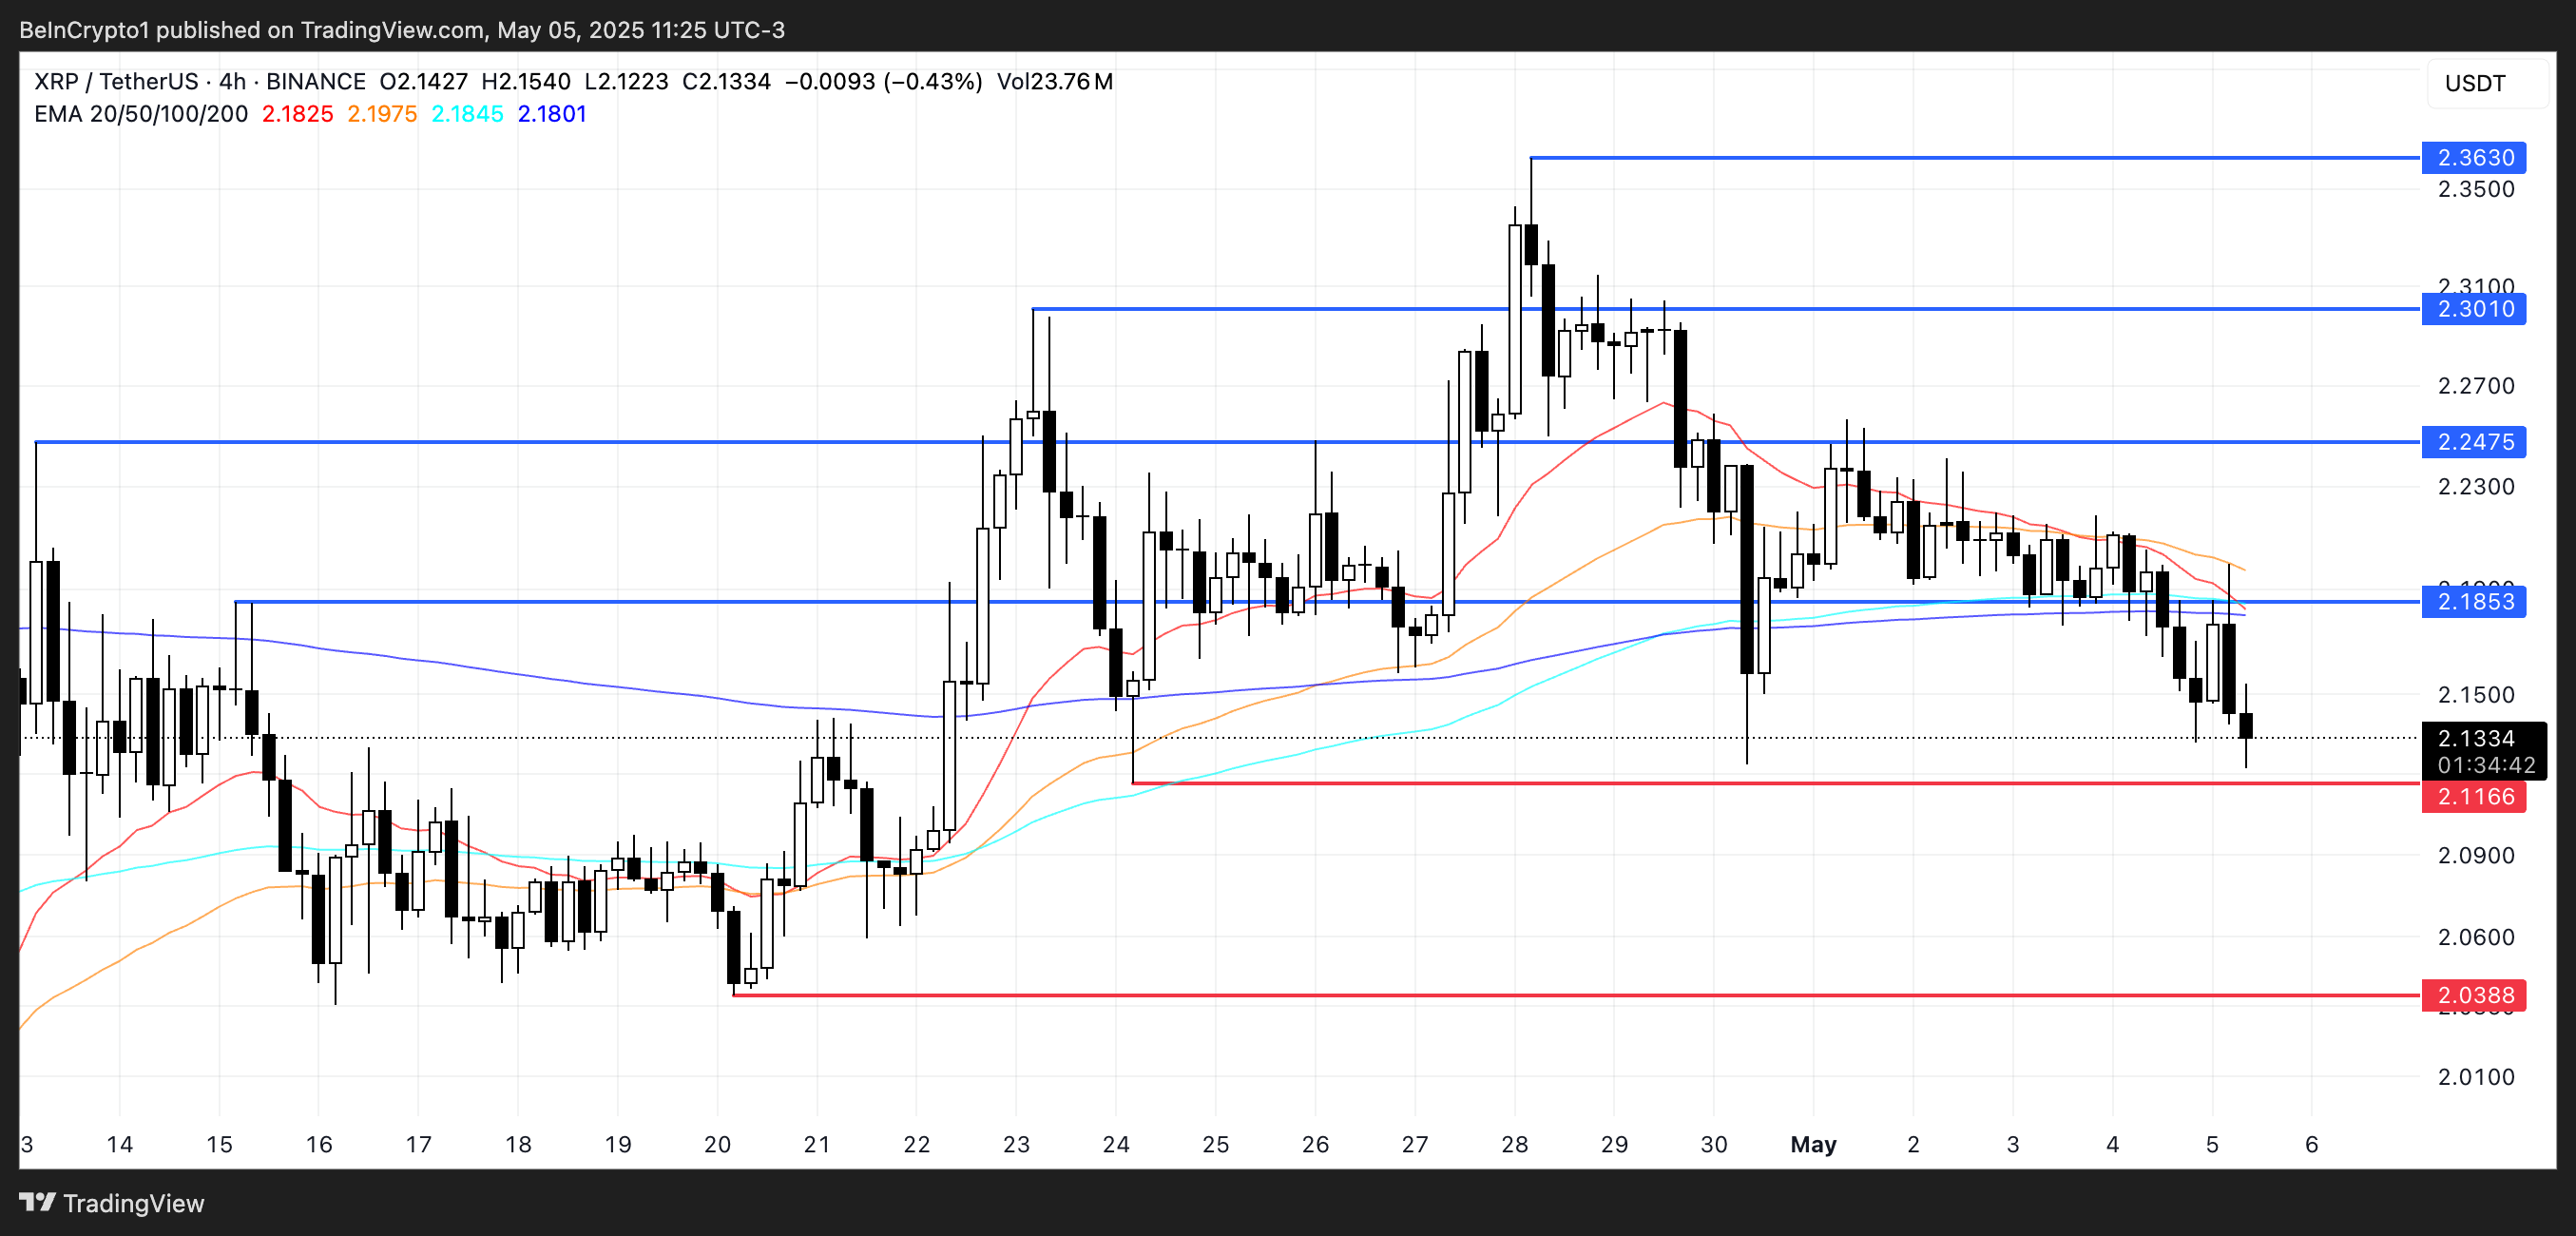
XRP’s exponential moving averages (EMAs) show signs of weakness, with a potential death cross formation on the horizon.
A death cross occurs when a short-term EMA crosses below a long-term EMA, signaling a possible shift into a sustained downtrend. If this bearish crossover confirms, XRP price could move down to test the support level at $2.11.
A failure to hold that level may accelerate the decline, opening the door for further losses toward $2.03.
 XRP Price Analysis. Source:
TradingView.
XRP Price Analysis. Source:
TradingView.
However, if XRP manages to regain strength and reverse current momentum, it could target resistance at $2.18.
A breakout above that level would be a short-term bullish signal and could push the price toward $2.24.
Continued buying pressure beyond that could set the stage for a move to $2.30 and possibly $2.36, especially if broader market sentiment improves.
Disclaimer: The content of this article solely reflects the author's opinion and does not represent the platform in any capacity. This article is not intended to serve as a reference for making investment decisions.
You may also like
Cardano community approves treasury funding to support upgrades across performance, scalability, and UX

Hacker still holds $14 billion in stolen Bitcoin from massive 2020 LuBian attack: Arkham

Whale 0xF436 Acquires Additional 10,245 ETH

Ethereum Falls Below $3,500 Amid Market Volatility
