Solana’s User Activity Sparks Double-Digit Price Jump, Positioning SOL for More Gains

Solana’s April surge in user activity has pushed SOL's price up 16%, with growing transactions and fees boosting its value. The network's momentum suggests continued bullish potential, but a price dip remains a risk.
Layer-1 (L1) blockchain network Solana has seen a notable rise in user demand this April. This surge in activity is evident across key metrics, including a marked increase in the network’s daily transactions, fees, and revenue.
This has prompted a spike in the demand for SOL, pushing its price up 16% over the past 30 days. With the network showing no signs of slowing down, SOL could continue its upward trajectory in the short term.
Network Activity Explodes on Solana, Pushing SOL Price Up
The rise in Solana’s user activity this month is evident in its growing daily transaction count. According to data from Artemis, the network has processed over 99 million transactions since the beginning of April, representing a 12% month-over-month increase in daily transactions.
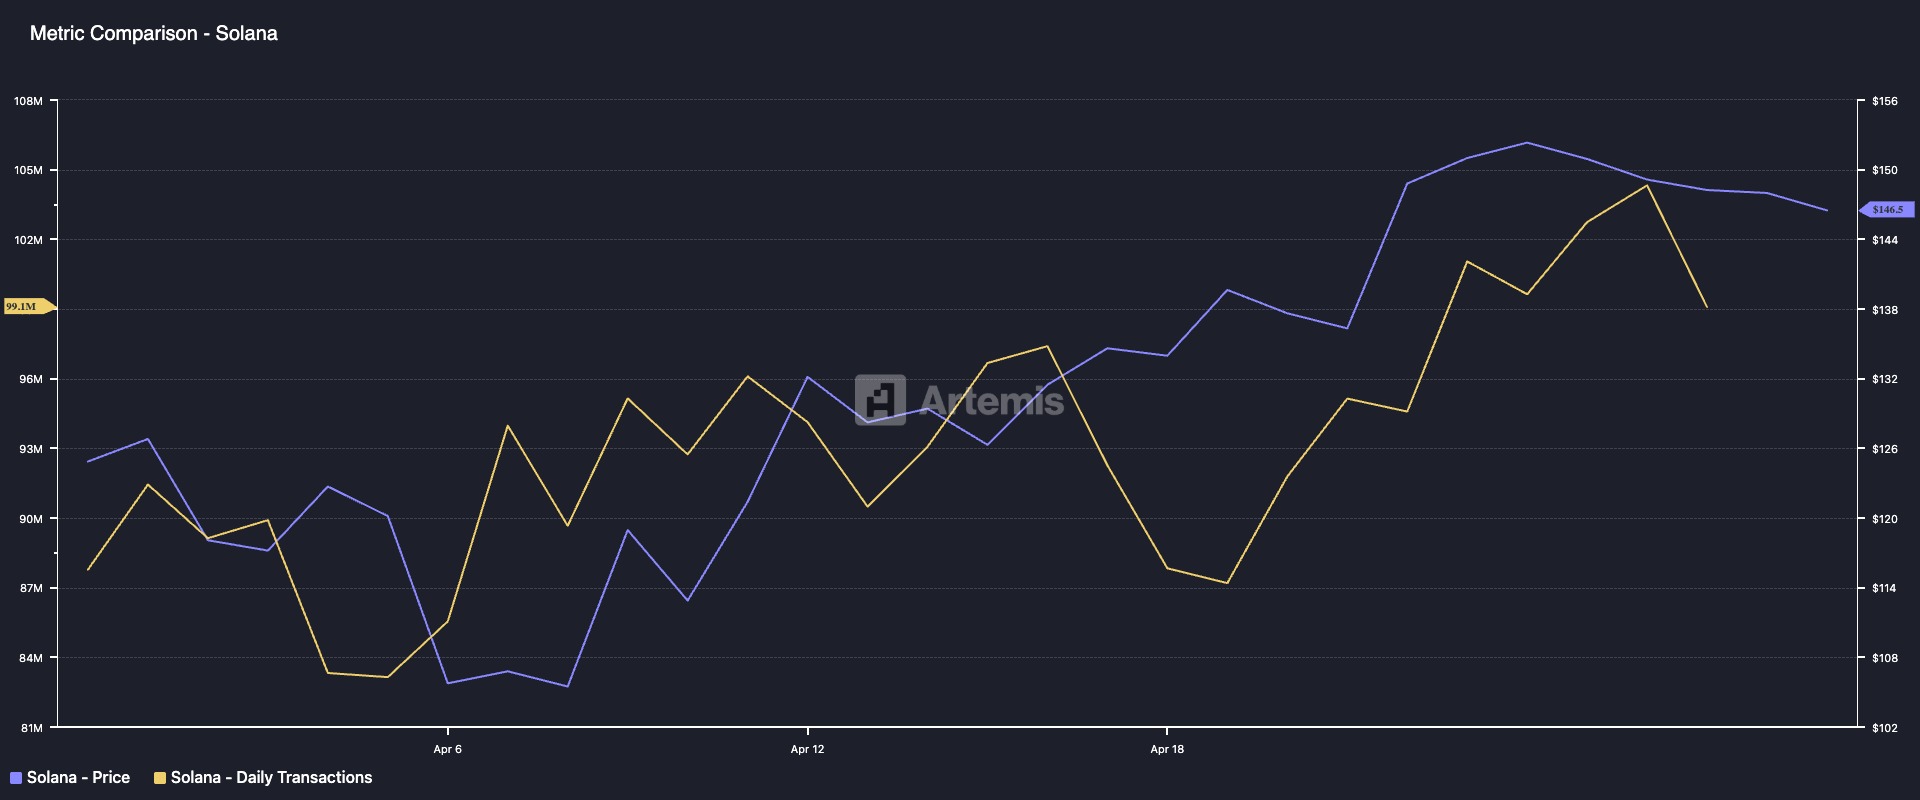 Solana Daily Transactions. Source:
Artemis
Solana Daily Transactions. Source:
Artemis
As a result of this increased user engagement, Solana’s network fees and the revenue generated from them have seen a notable uptick. According to Artemis, transaction fees on the network have surged by 35%, while revenue derived from these fees has climbed by 26% over the same period.
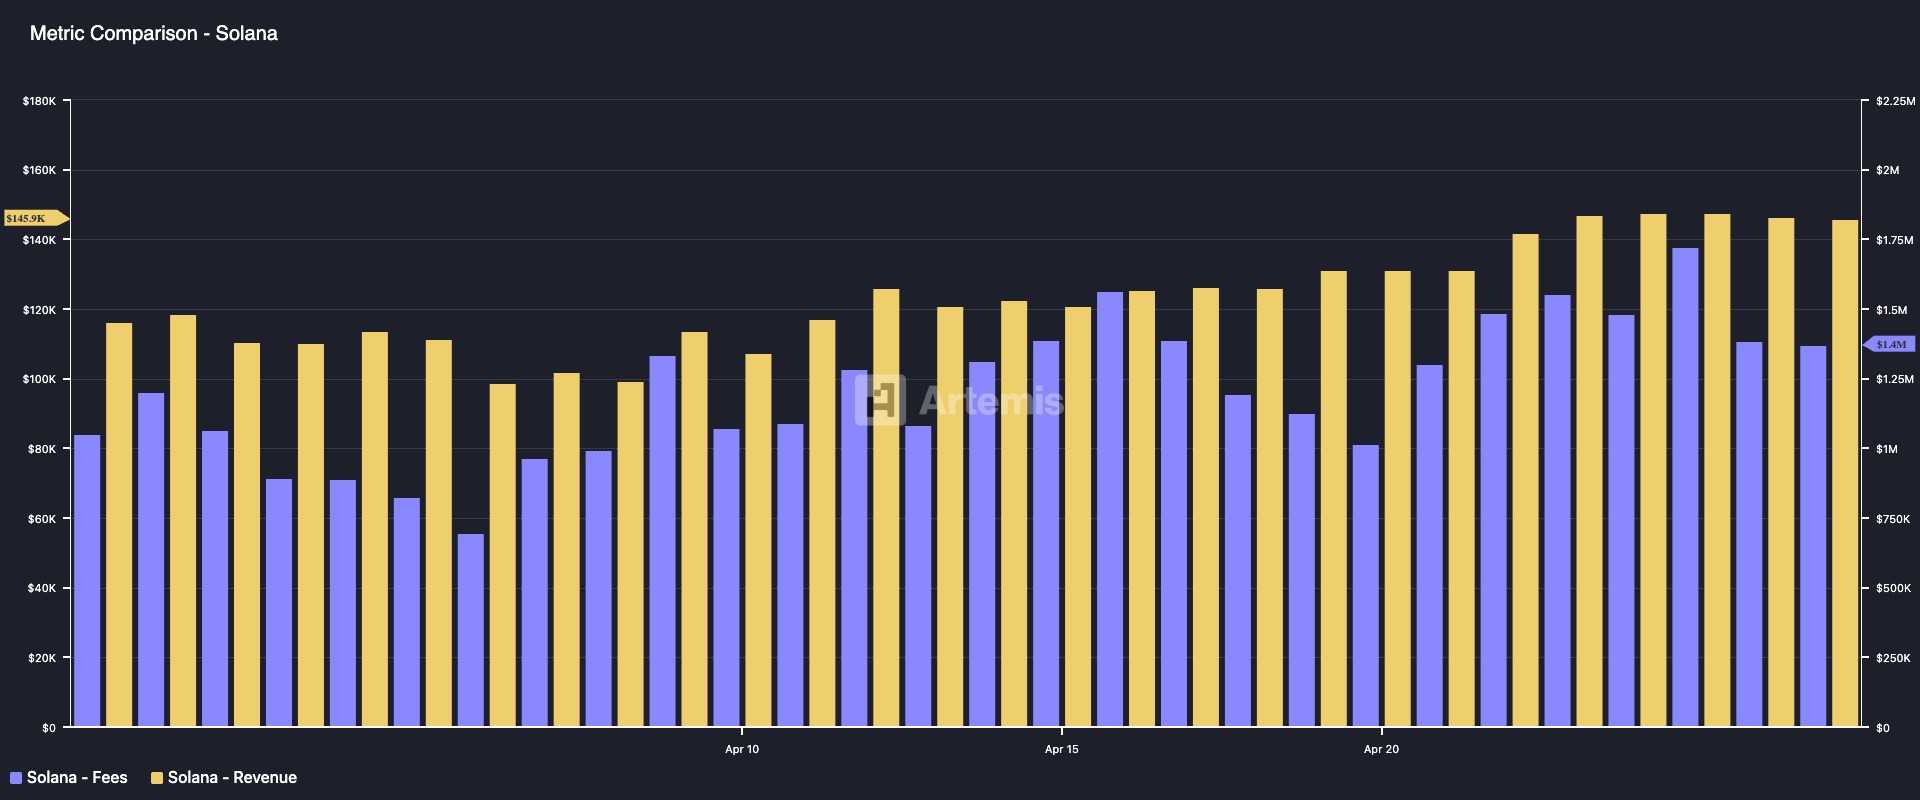 Solana Network Fees and Revenue. Source:
Artemis
Solana Network Fees and Revenue. Source:
Artemis
The surge in user activity across the Solana network has fueled demand for its native token, SOL. This is because, as more users interact with the L1, the need for SOL to facilitate transactions and pay network fees increases.
This has contributed to a double-digit price rally, with SOL climbing by over 16% in the past month. The price surge reflects growing investor confidence in the network and highlights the positive correlation between user activity and token value.
Hence, if user activity remains high on Solana, SOL could remain bullish into the new month.
Bullish Pressure Builds for SOL, but Drop to $120 Still in Play
On the daily chart, readings from SOL’s Directional Movement Index (DMI) confirm the buying pressure among its spot market participants. At press time, SOL’s positive directional index (+DI, blue line) rests above its negative directional index (-DI, orange line).
The DMI indicator measures the strength of an asset’s price trend. It consists of two lines: the +DI, which represents upward price movement, and the -DI, which means downward price movement.
As with SOL, when the +DI rests above the -DI, the market is bullish, with upward price movement dominating the market sentiment. If this persists, SOL could extend its rally and climb toward $171.88.
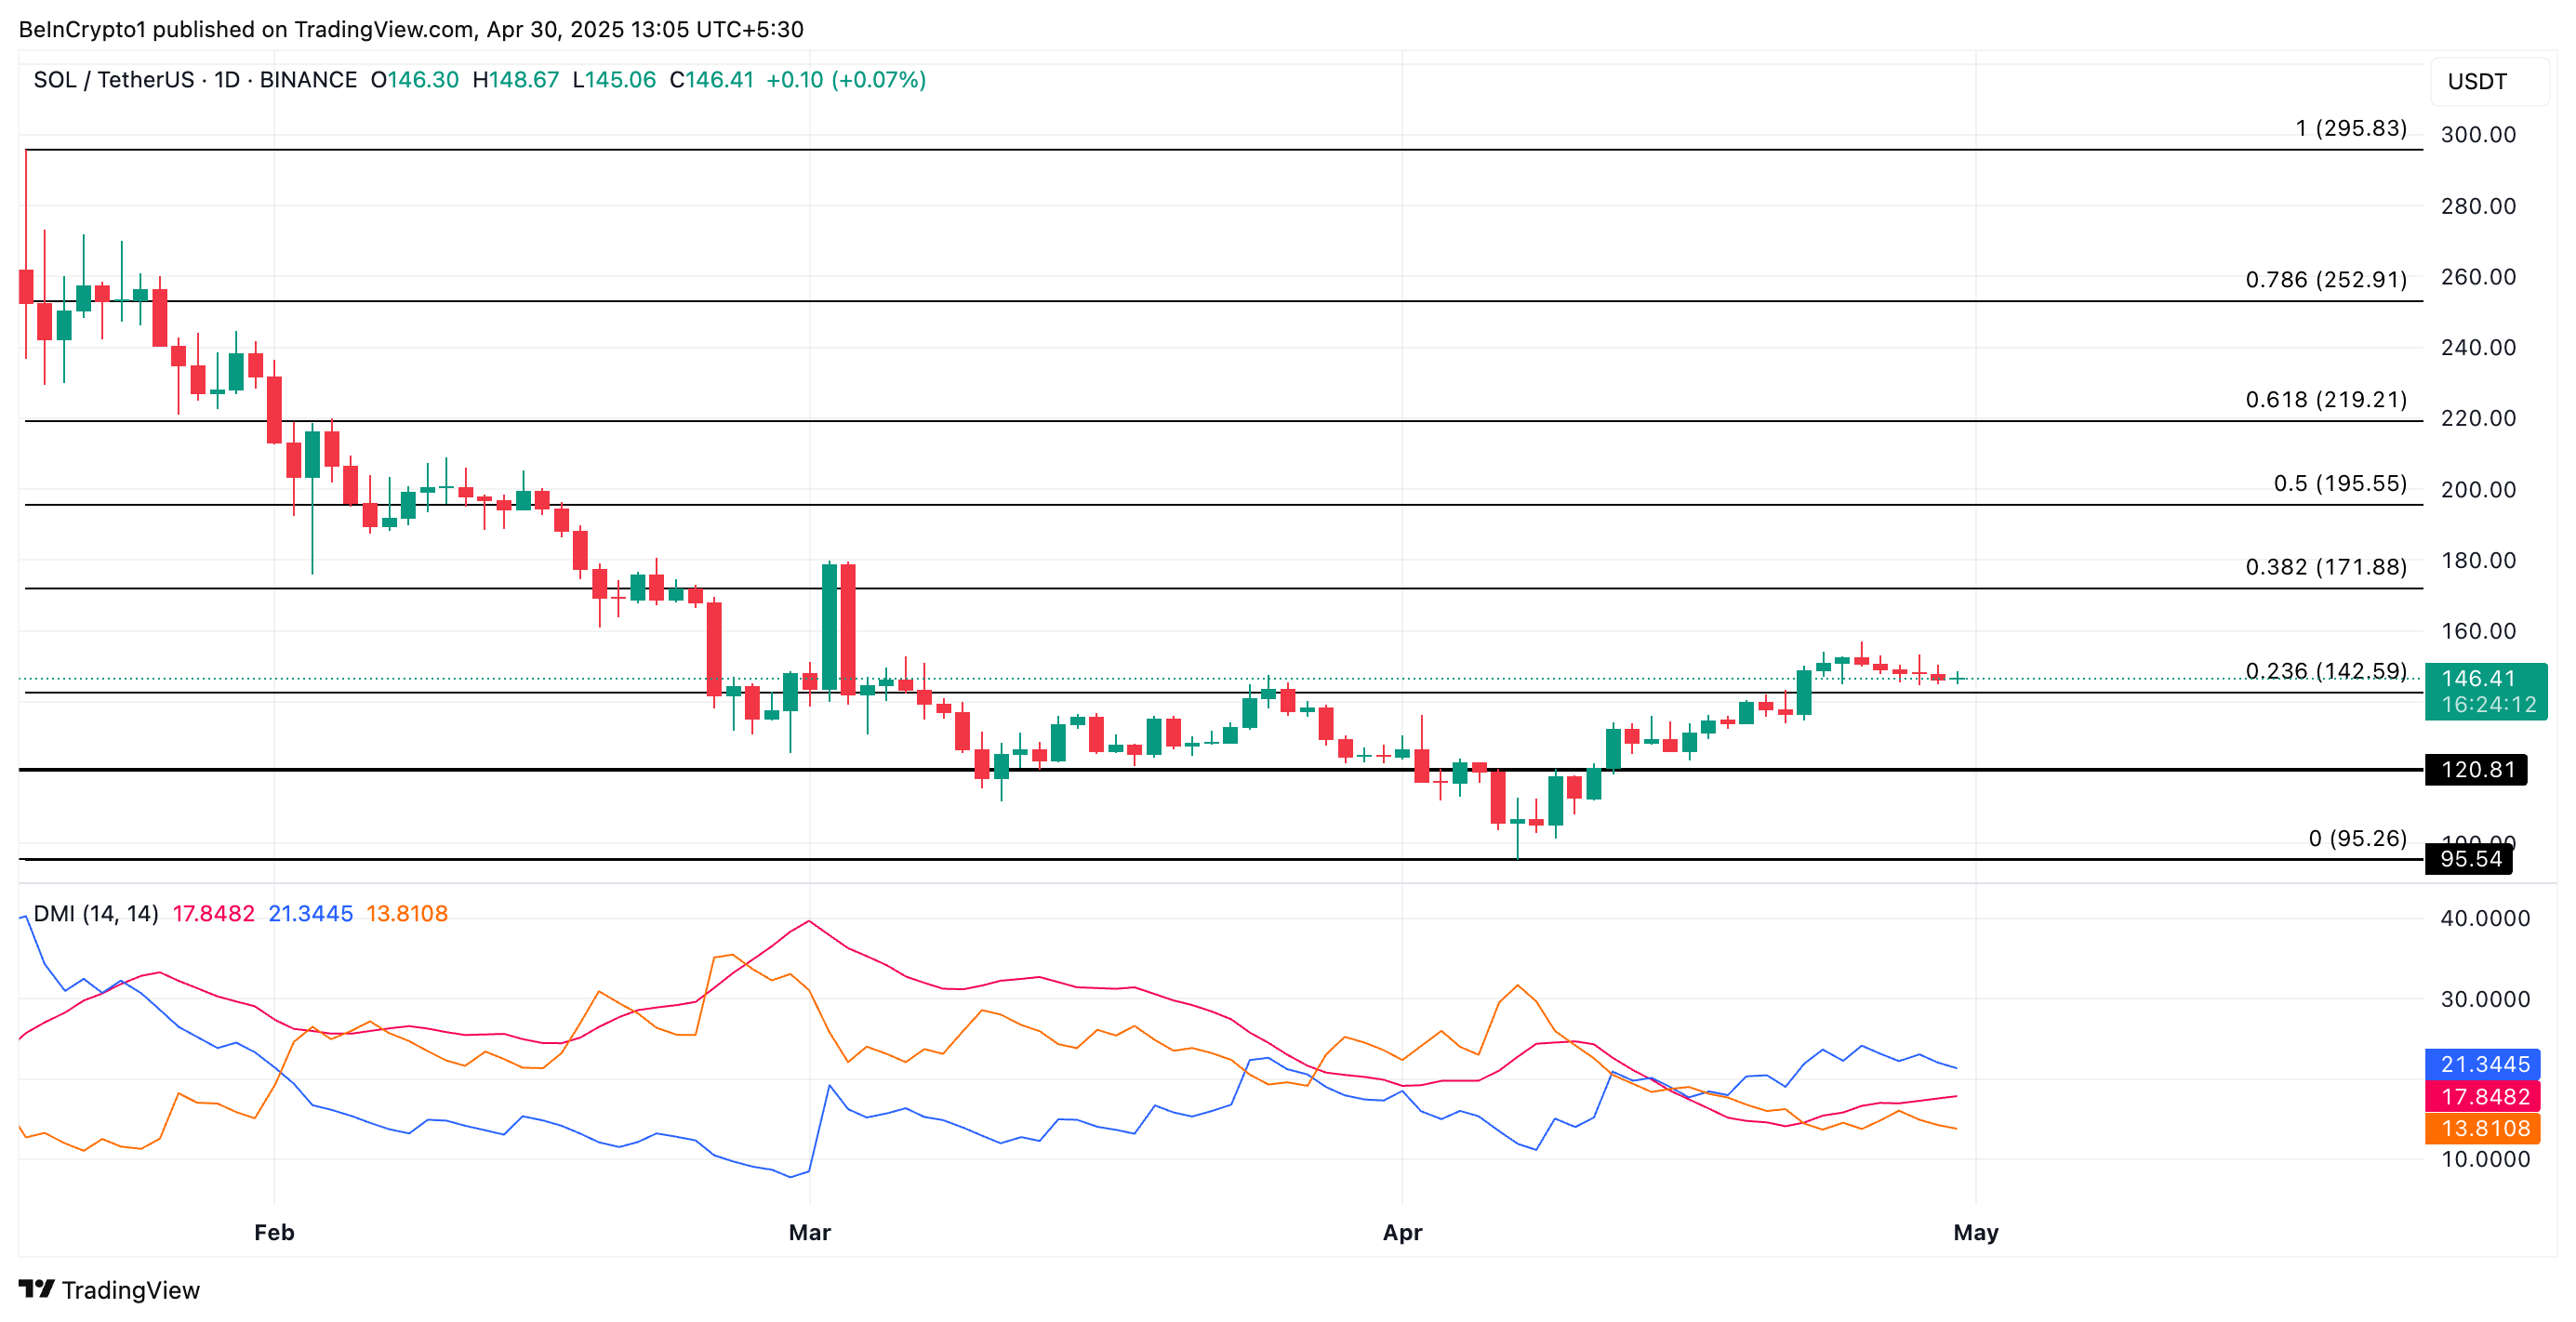 SOL Price Analysis. Source:
TradingView
SOL Price Analysis. Source:
TradingView
However, if Solana’s user activity wanes, impacting the demand for SOL, the coin’s price could shed recent gains, break below support at $142.59, and fall to $120.81.
Disclaimer: The content of this article solely reflects the author's opinion and does not represent the platform in any capacity. This article is not intended to serve as a reference for making investment decisions.
You may also like
How Pectra Upgrade is Reshaping the Ethereum Staking Ecosystem and L2 Landscape
Pectra's upgrade is not just a regular feature iteration; it outlines a clearer path for Ethereum's future in key areas such as Staking mechanism optimization, L2 scalability, and account abstraction.

MOODENG price drops 14% to $0.2613 after 703% weekly rally

Bitwise CIO bats for diversified crypto investment, compares Bitcoin to Google

USD1 Airdrops Likely Amid Overwhelming WLFI Community Support
World Liberty Financial plans to issue USD1 stablecoin airdrops to eligible WLFI holders, marking a key step in expanding its reach. The initiative has gathered overwhelming support but faces regulatory challenges.