
Ethereum price below fair value indicates possible recovery, says Fidelity

- Ethereum Price Suggests Possible Technical Undervaluation
- Indicators show capitulation among ETH investors
- Fidelity Highlights Ethereum’s Recovery Potential
The latest Signals Report from Fidelity Digital Assets ready that Ethereum may be trading below its fair value, even after a steep 45% drop in the first quarter of 2025. According to the document, ETH lost the gains recorded after the US elections, having reached a high of $3.579 in January, but retreated to the $1.754 range.
The report highlights the formation of a death cross in March, when the 50-day simple moving average fell about 21% below the 200-day moving average. Such technical movement usually reflects a strong bearish bias in the short term. However, Fidelity analysts suggest that this behavior could signal an opportunity, with Ethereum showing signs of being undervalued.
One of the metrics cited in the report is the MVRV Z-Score, which hit -0,18 on March 9. This indicator measures the relationship between the market value and the realized value of the asset. When negative, as is the case today, it indicates that Ethereum is trading below its average historical value, which has historically coincided with market bottoms.
Another relevant piece of data is the NUPL (Unrealized Net Profit/Loss), which fell to 0 — indicating a moment of “capitulation”, in which unrealized profits were neutralized by unrealized losses, marking a point of psychological balance among investors.
Realized price is a metric that aims to capture the average cost basis of all current token holders. By capturing the last traded price of a token, tokens that are presumed to be lost can be discounted. Realized price has acted as a support level since January 2023, prior to Q10, where the price is currently 10% below realized price. Simply put, ether holders as a group are now experiencing an unrealized loss of XNUMX%.
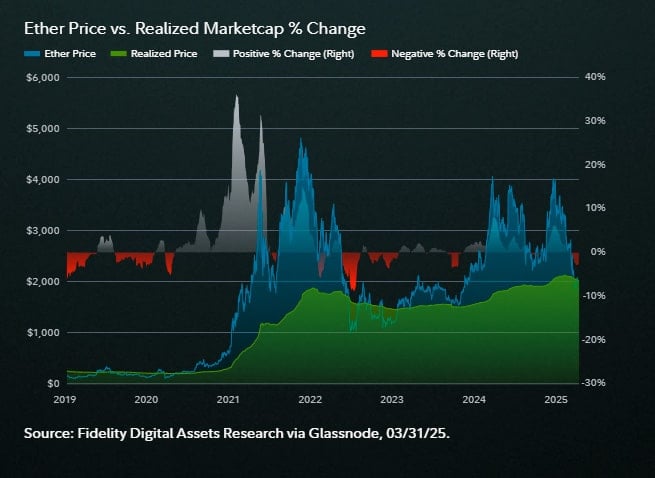
Ether was trading approximately 59% above its realized price of $2.094 at the end of Q2024 2025. Over the course of Q45 1.822, the price fell 3% to $2.020, while the realized price fell only XNUMX% to $XNUMX. This small drop in realized price, compared to the large drop in price, could indicate that short-term holders are capitulating more than long-term holders, driving the price down but keeping the realized price relatively stable.
During bear markets, this realized price often acts as support, while during bullish periods, the price of Ether can extend significantly above it. For example, the price has consistently traded below the realized price throughout 2022. It could be argued that these periods marked significant buying opportunities. However, during this period, the price fell as much as 38% below the realized price, proving that this specific realized price level did not provide any tangible support throughout 2022.
Therefore, while this metric can be used to signal a historically undervalued period, it is important to note that price has historically moved significantly away from realized price on both the low and high. Ether Price 50-Day SMA 200-Day SMA Ethereum: 50-Day vs. 200-Day vs.
Still, the report notes that in 2022, ETH has already traded below its realized price and continued to fall before reversing the trend. Finally, Ethereum's share of Bitcoin's market cap is at 0,13 — a level not seen since mid-2020, in a continuous decline for 30 months.
Disclaimer: The content of this article solely reflects the author's opinion and does not represent the platform in any capacity. This article is not intended to serve as a reference for making investment decisions.
You may also like
CandyBomb x POWER: Trade to share 4,387,500 POWER
New users get a 100 USDT margin gift—Trade to earn up to 1888 USDT!
Bitget Spot Margin Announcement on Suspension of DOG/USDT, ORDER/USDT, BSV/USDT, STETH/USDT Margin Trading Services
BGB holders' Christmas and New Year carnival: Buy 1 BGB and win up to 2026 BGB!