
Mantra (OM) Slides 5% as Potential Death Cross Looms

Mantra (OM) is losing momentum with bearish technical signals stacking up. A drop below $6 could mark a deeper correction phase.
Mantra (OM) is down 20% over the last 30 days and 5% today. Despite this recent correction, it remains the second-largest RWA (real-world asset) token in the market.
The technical outlook shows growing signs of weakness, with indicators suggesting the current consolidation could shift into a downtrend. At the same time, key support levels are being tested, and a potential death cross is forming on the EMA chart.
Mantra ADX Shows The Current Consolidation Could Change
Mantra’s ADX is currently at 22.96, a drop from 26.5 just a day ago, signaling a weakening trend. The ADX, or Average Directional Index, measures the strength of a trend without indicating its direction.
Readings below 20 generally suggest a weak or non-trending market, while values above 25 indicate a strong trend is forming or in progress.
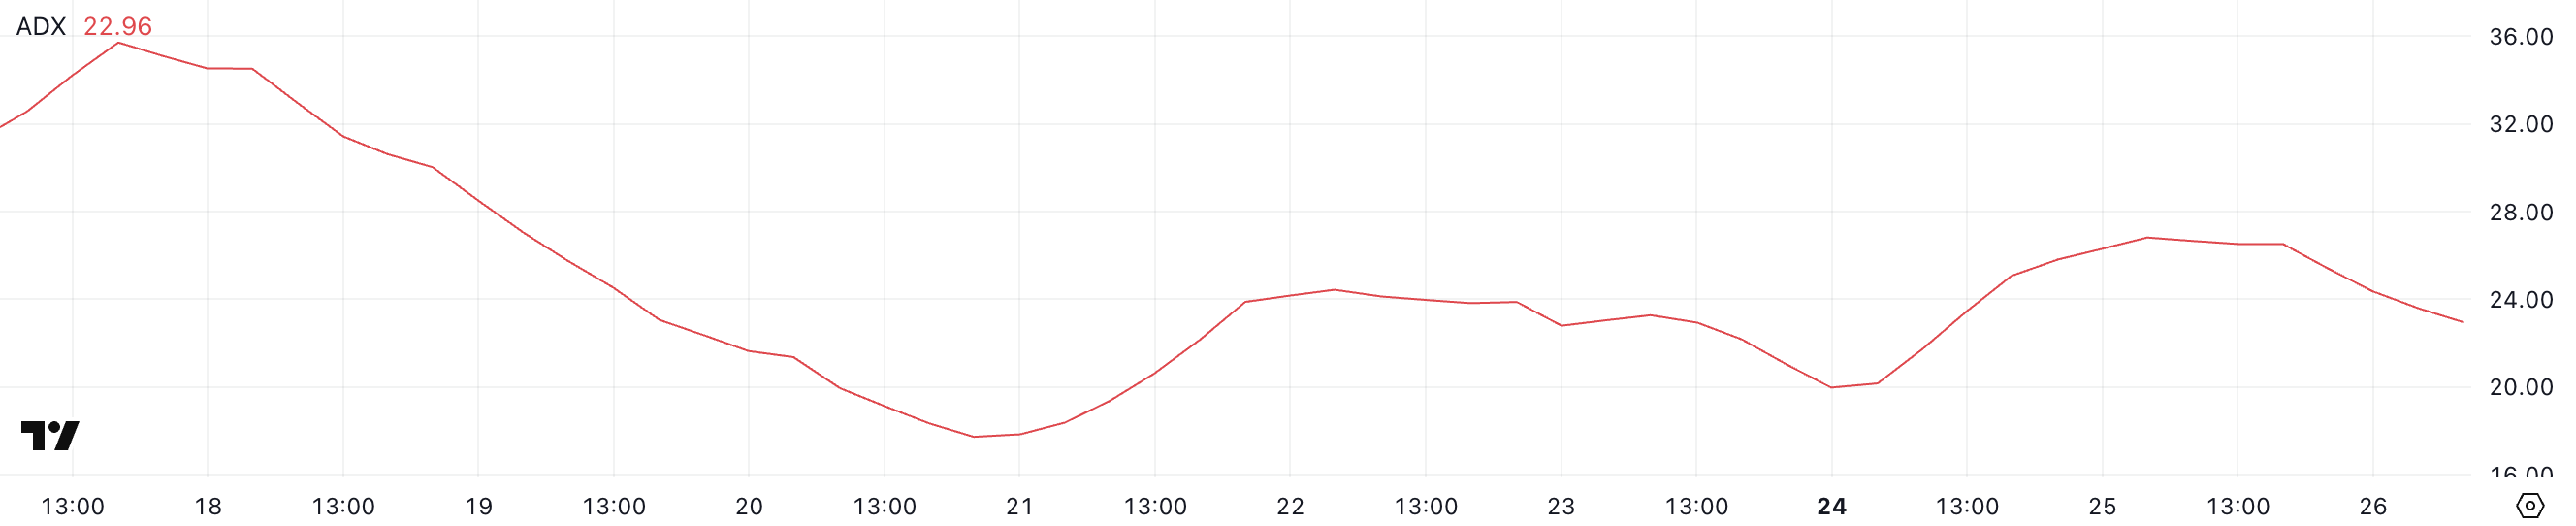 OM ADX. Source:
TradingView.
OM ADX. Source:
TradingView.
With OM’s ADX now slipping below the key 25 threshold, it suggests that the previous trend—a consolidation—may be losing strength.
The drop also aligns with early signs of a potential shift toward a downtrend, especially if selling pressure builds. If the ADX continues to fall while bearish momentum rises, it could confirm that Mantra is transitioning out of consolidation and into a downward phase.
Ichimoku Cloud Shows A Bearish Trend Could Intensify
Mantra’s Ichimoku Cloud chart currently shows a market in hesitation, with the price moving along the edge of the cloud. This positioning reflects a state of consolidation, where neither buyers nor sellers have full control, as Mantra keeps its position as the second biggest RWA coin in the market.
The Tenkan-sen (blue) and Kijun-sen (red) lines are flat and close together, a typical sign of weak momentum and sideways movement in the short term. This setup often precedes a breakout, but the direction remains uncertain until a clear move occurs.
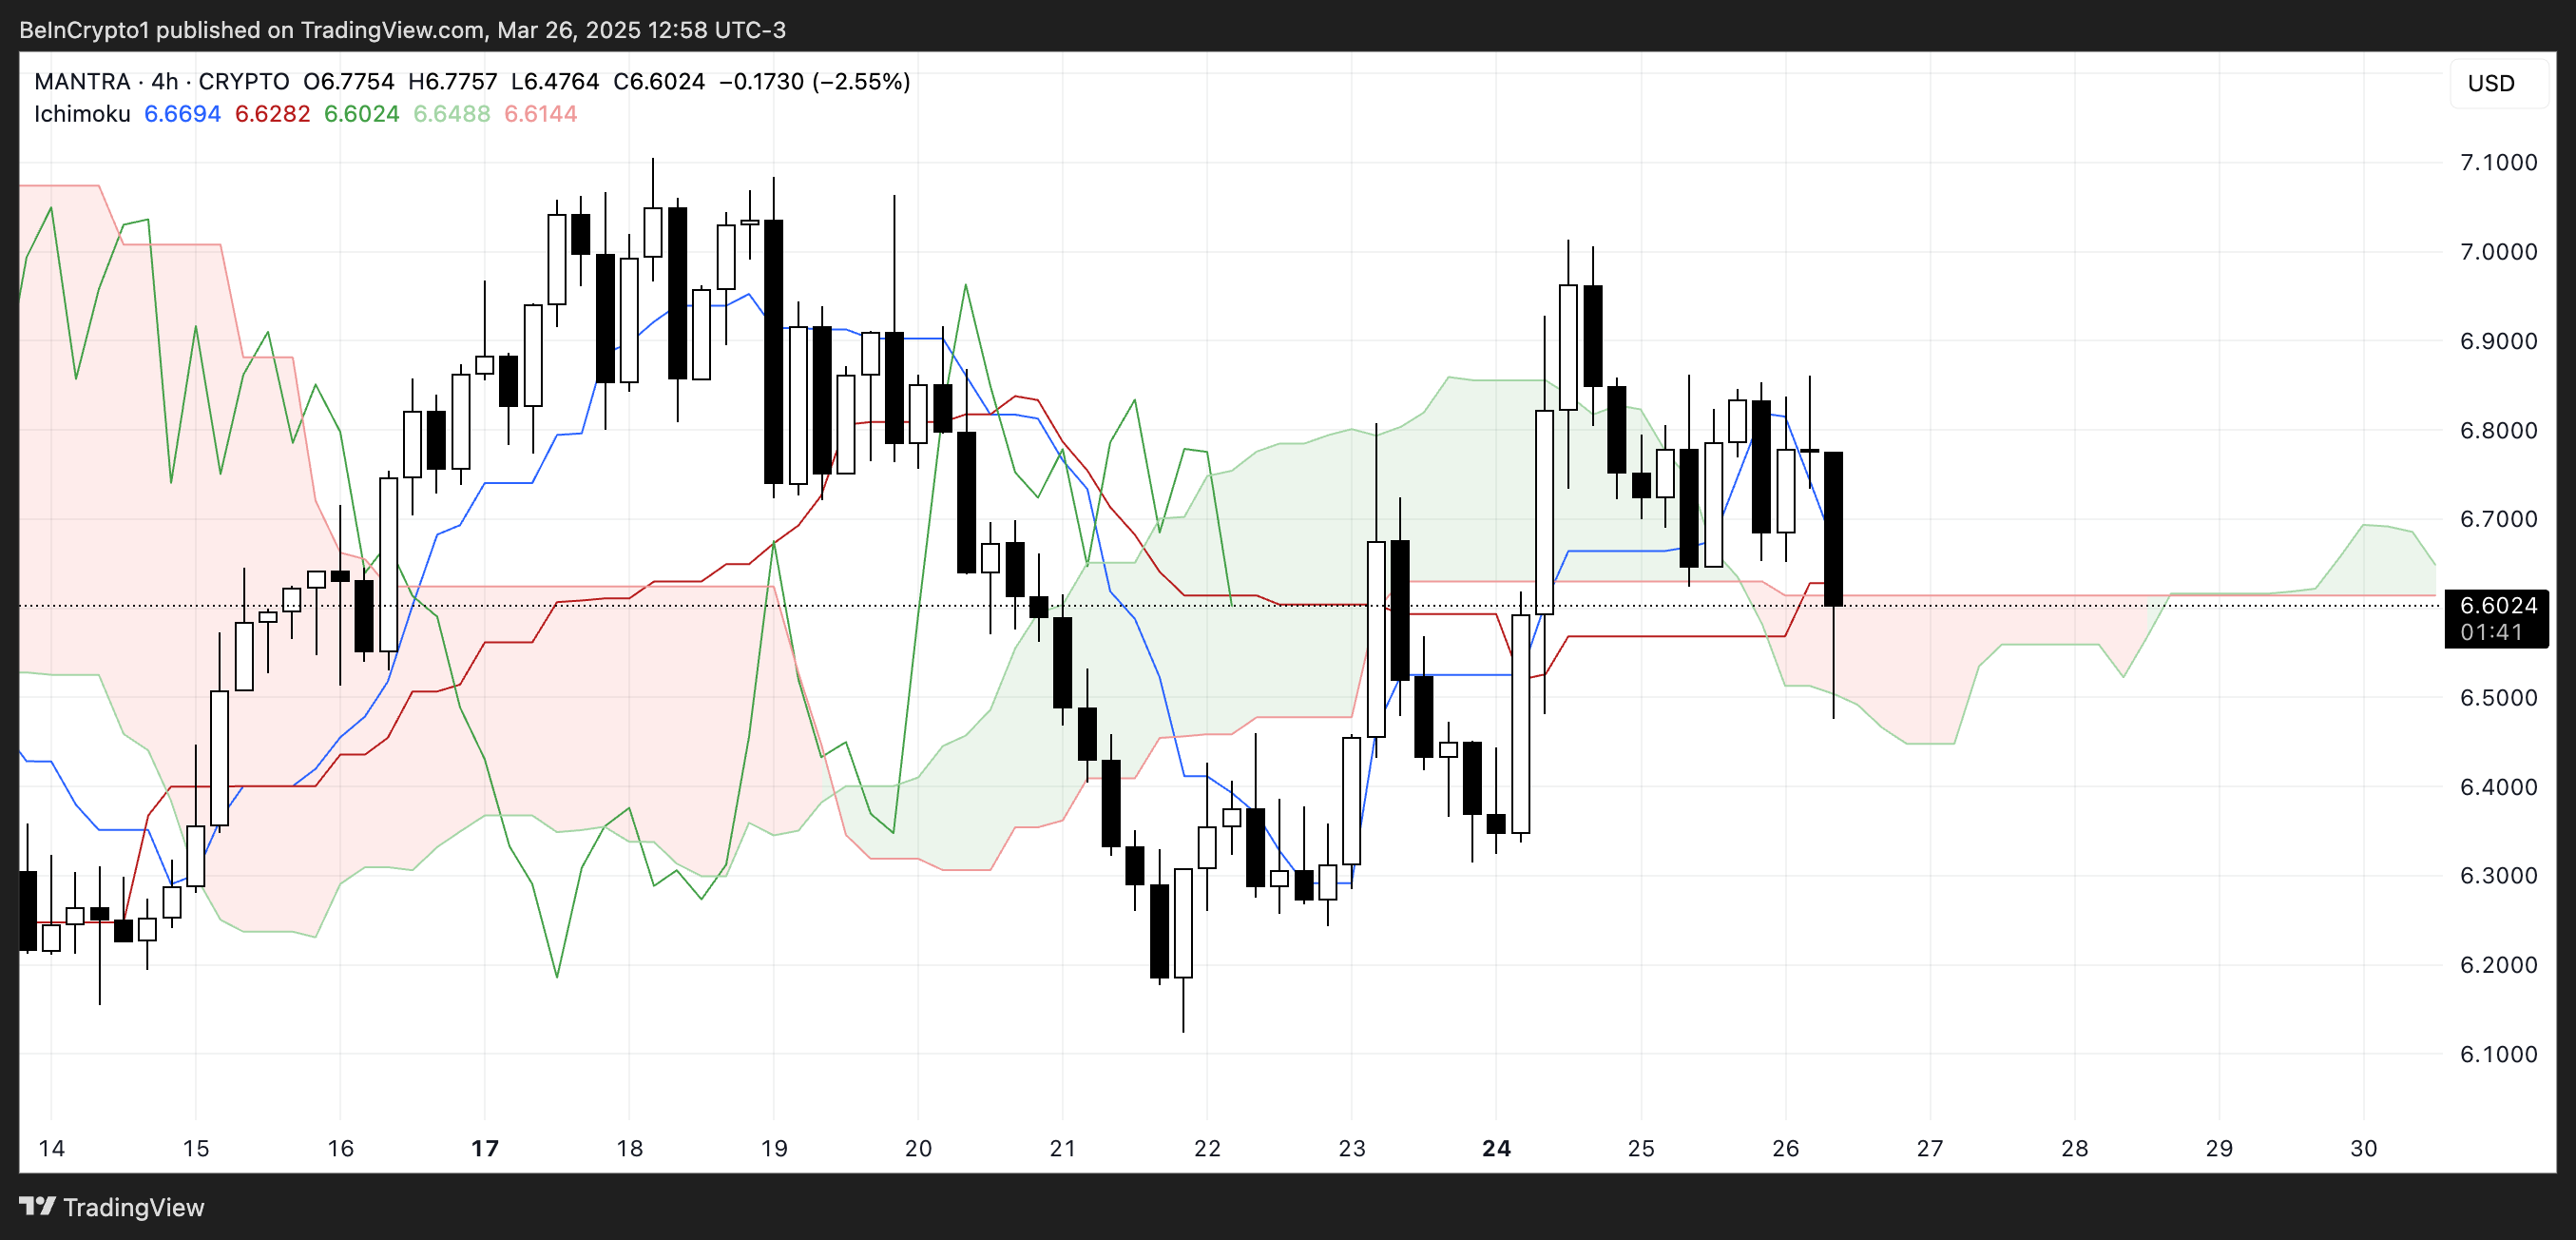 OM Ichimoku Cloud. Source:
TradingView.
OM Ichimoku Cloud. Source:
TradingView.
The future cloud is thin and has turned slightly bearish (red). It indicates that support ahead is weak and could be easily broken if selling pressure increases.
Additionally, the Chikou Span (lagging line) is entangled with recent price action, another indicator that OM lacks strong directional conviction.
While the price hasn’t decisively broken below the cloud yet, any further downside could shift the bias toward a confirmed downtrend. For now, OM remains in a vulnerable position. Traders will be watching closely to see if the cloud acts as support—or gives way.
Can Mantra Fall Below $6 Soon?
MANTRA’s EMA lines are signaling potential weakness, with a possible death cross forming soon—a bearish pattern in which short-term moving averages cross below long-term ones.
If this pattern is confirmed and downward pressure increases, OM could fall to test the support at $6.15. A break below that level may lead to a further drop toward $5.85, signaling a deeper correction phase in the absence of renewed bullish momentum.
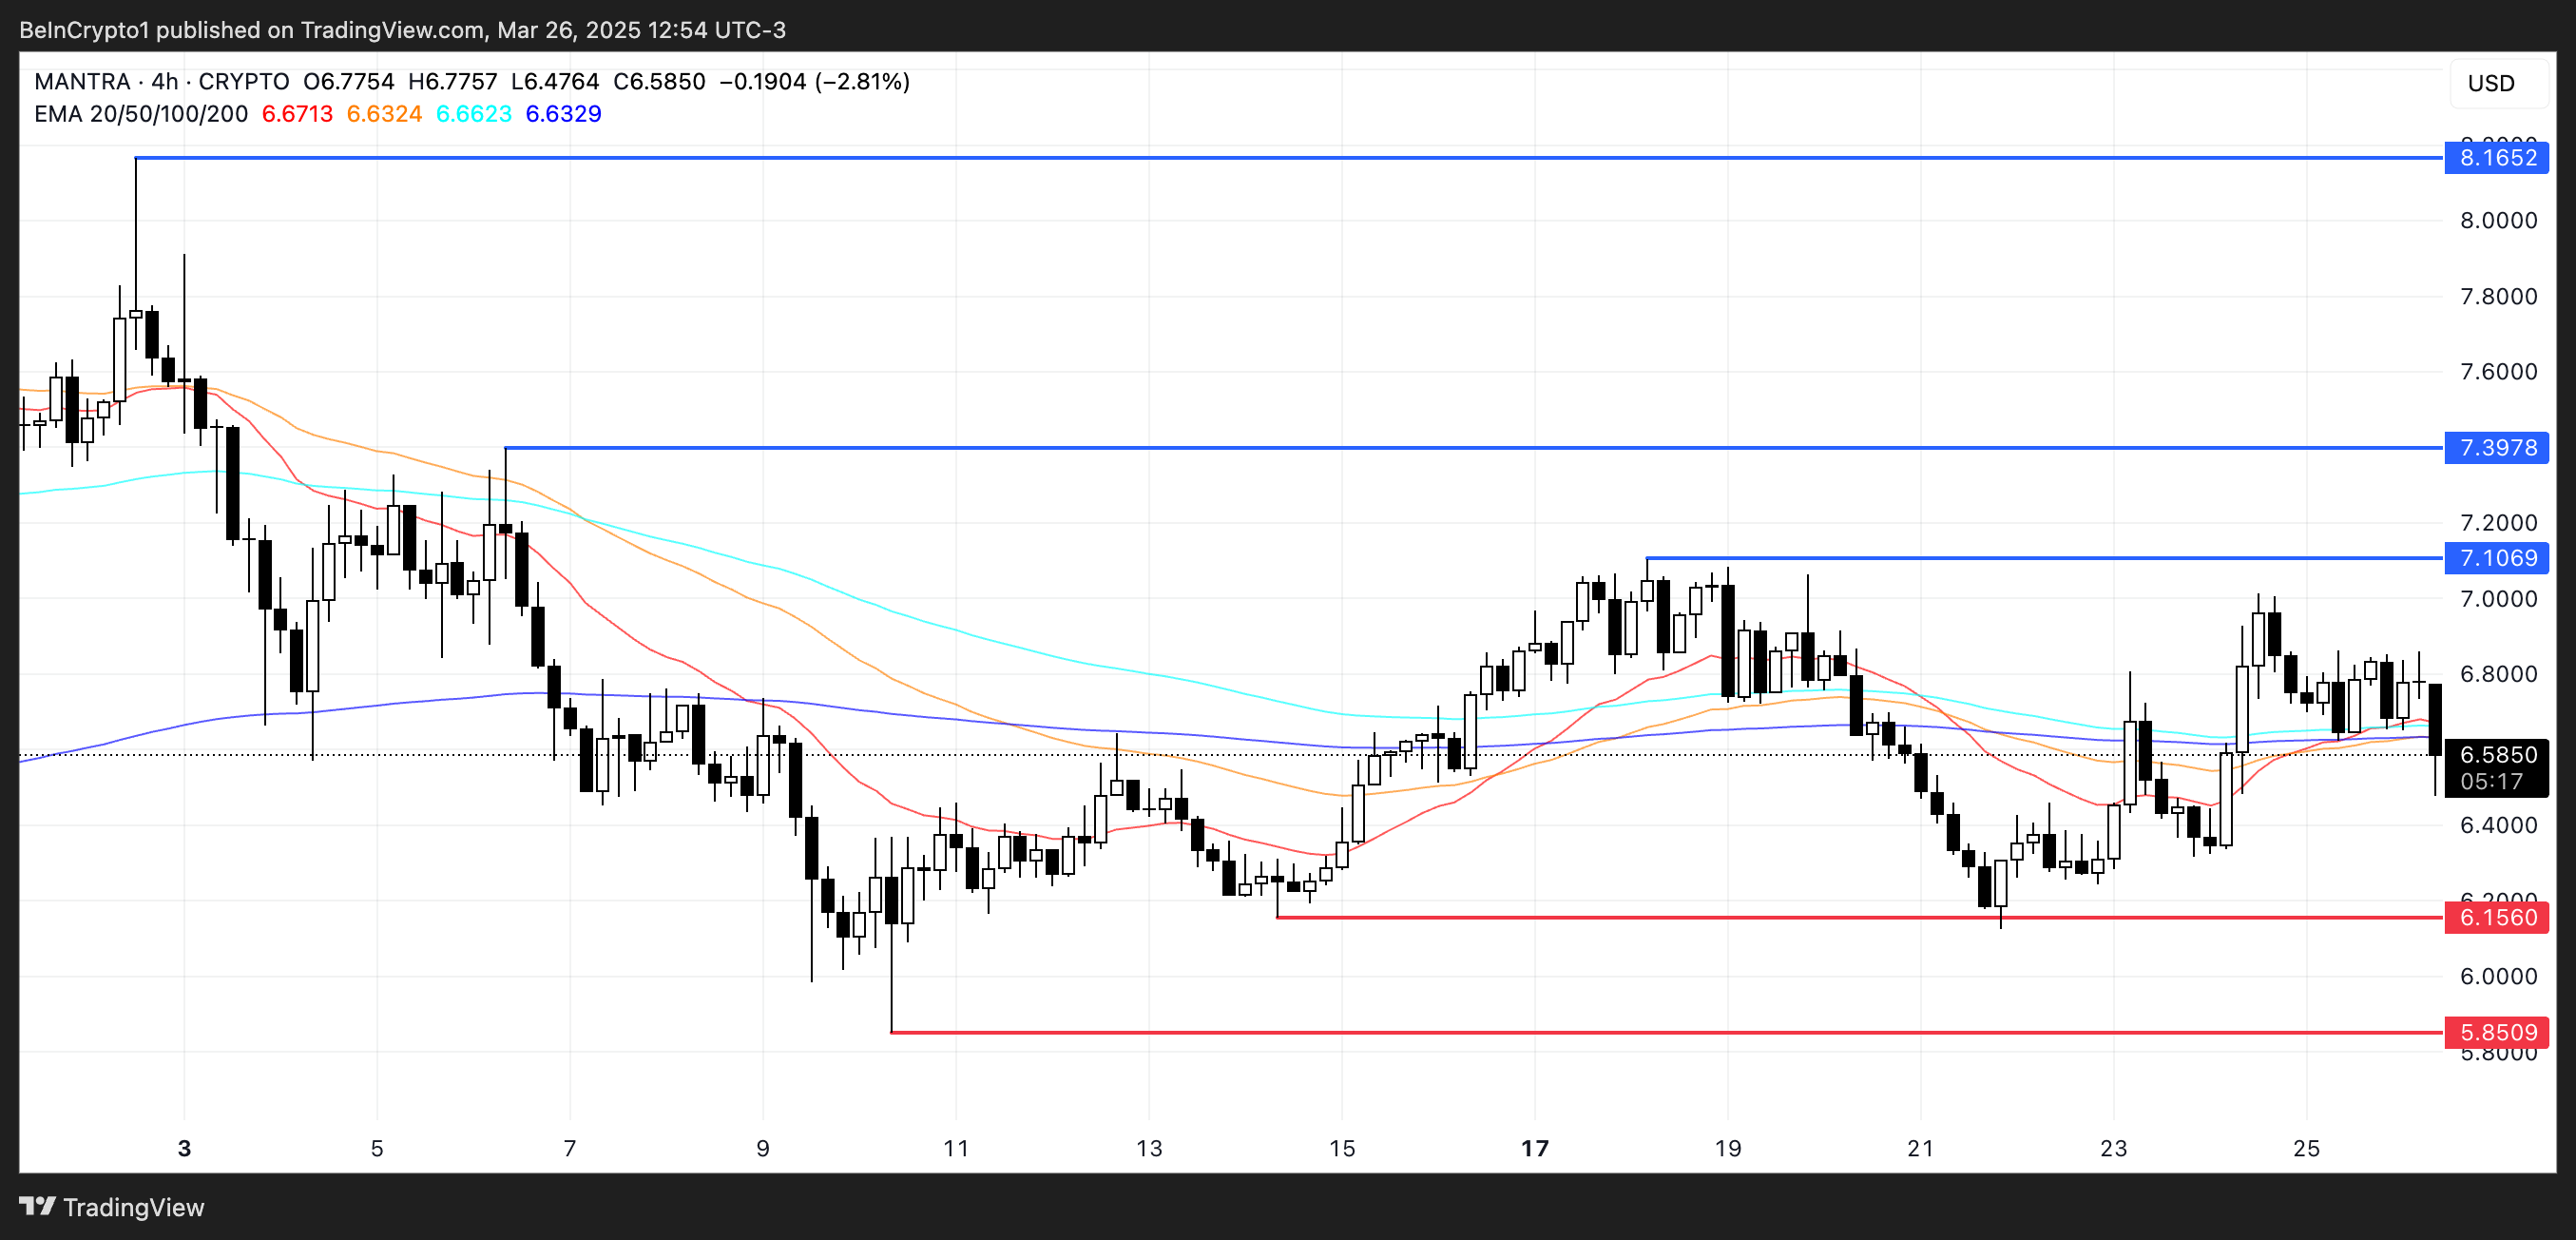 OM Price Analysis. Source:
TradingView.
OM Price Analysis. Source:
TradingView.
However, if sentiment around RWA coins picks up again, Mantra could see a trend reversal. In that case, OM might rally toward the $7.10 resistance level and, if broken, target $7.39 next.
Should the uptrend mirror the strength seen in previous months, OM could even climb above $8 to test $8.16 for the first time since late February.
Disclaimer: The content of this article solely reflects the author's opinion and does not represent the platform in any capacity. This article is not intended to serve as a reference for making investment decisions.
You may also like
British Gold Miner Nativo Resources Adopts Bitcoin Treasury

Bitcoin Cycle Theory May Be Changing as Analyst Revises Previous Bear Market Prediction

Injective Launches $SBET, Tokenizing SharpLink Shares
Injective introduces $SBET, tokenizing SharpLink shares, marking a major step in digital asset treasury innovation.What Is $SBET and Why Does It Matter?Injective’s Vision for Tokenized Finance
Trump Signals Rate Cuts After Powell Meeting
Trump expresses confidence that interest rates will fall soon, hinting at a market surge driven by retail momentum.Trump Hints at Coming Rate CutsWhy Lower Rates Matter for CryptoPerfect Timing for a Retail Comeback?