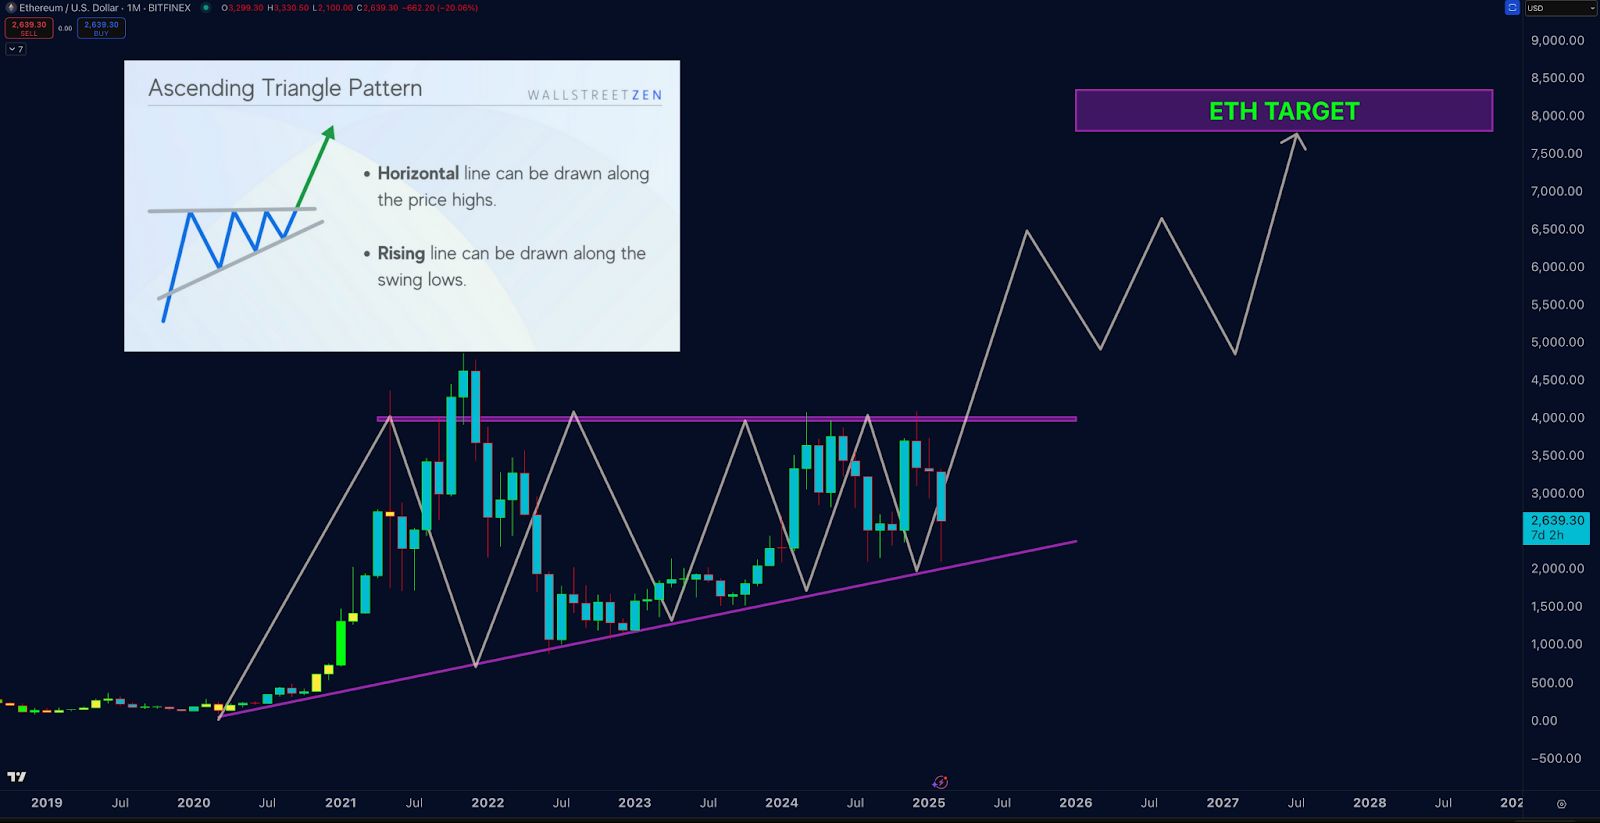
- Ethereum’s ascending triangle signals a possible breakout, with $4,000 as key resistance before a potential rally.
- Buying pressure is rising as sellers struggle, mirroring past accumulation phases that led to strong bullish moves.
- A breakout could push Ethereum to $8,000, but failure may lead to extended consolidation or a downside move.
Ethereum shows an ascending triangle formation, indicating a probable breakout. The price is $2,639.30, holding in the formation. There is a horizontal resistance line parallel to past highs, and an inclined trendline acting as support to higher lows. Market structure is that of good buying pressure irrespective of multiple rejections at the resistance level. Ethereum’s breakthrough above this resistance would trigger a massive rally.
Ethereum’s Price Structure and Market Dynamics
Ethereum has consistently formed higher lows , maintaining its long-term bullish structure. The price has faced resistance around $4,000, leading to compression within the triangle. Moreover, this pattern suggests increasing buying pressure as sellers struggle to push prices lower. Historically, ascending triangles often precede strong breakouts, making this setup critical for Ethereum’s trajectory.
 Source: Doctor profit
Besides, the asset’s previous rally from 2020 to 2021 saw a rapid surge before reaching its all-time high. After that, a corrective phase followed, leading to the formation of the current triangle. This phase indicates a period of accumulation before a decisive move. If Ethereum sustains momentum above resistance, bullish continuation remains likely. However, failure to break out may result in prolonged consolidation or a downward shift.
Potential Breakout and Price Targets
According to crypto analyst Doctor Profit , Ethereum could reach $8,000 if it breaks above the ascending triangle. This target aligns with historical price extensions from similar patterns. Additionally, market participants are closely monitoring volume and momentum indicators. These factors will determine the breakout’s strength and sustainability.
A confirmed breakout may trigger a surge in buying activity, reinforcing bullish sentiment. Moreover, traders assess risk-to-reward ratios based on entry points and breakout confirmation. If the price breaches the ascending support line, the bullish setup would lose validity.
Ethereum’s long-term structure positions it for a decisive move in the coming months. Moreover, Technical analysis backs up the likelihood of a long-term rally. The asset’s future course is still heavily influenced by volume, market circumstances, and outside variables. When making trading selections, investors should be alert and take technical indicators into account.
DISCLAIMER: The information on this website is provided as general market commentary and does not constitute investment advice. We encourage you to do your own research before investing.