- Bitcoin price dropped by 4.25% in the last 24 hours as per CMC data.
- The cryptocurrency’s US spot ETFs witnessed massive outflows on September 3.
Crypto traders have inclined their attention towards Bitcoin in the past month anticipating for price recovery. The cryptocurrency, on the other hand, showed redundant struggles to break resistance beyond $65K. Prices have consolidated at the $59K level since August. In the last 24 hours, Bitcoin prices revisited support levels at $56,000.
Notably, the largest cryptocurrency’s downward movement has reflected on the overall market cap and leading altcoins such as Ethereum . Bitcoin began its price fall in the Asian evening hours of September 3 and sustained the movement into the past hours. At the time of writing, Bitcoin was trading at $56,545 as per CMC data .
Additionally, the token rendering to the bearish movement hit a 20-day low of $55,663 in the last few hours. While Bitcoin’s Q3 2024 has been quite bearish its Year-to-date price performance stands positive showing a 33.25% price increase.
Furthermore, Bitcoin’s US spot ETFs witnessed massive outflows post the US labour day on September 3. According to Sosovalue data, the ETFs recorded $287.78 million in daily net flows which is the second highest since $563.77 million one-day outflow on May 1. Among individual ETFs, 8 out of the 12 saw outflows. The remaining four ETFs showed zero net flows.
What Do Technical Indications Depict for Bitcoin Price?
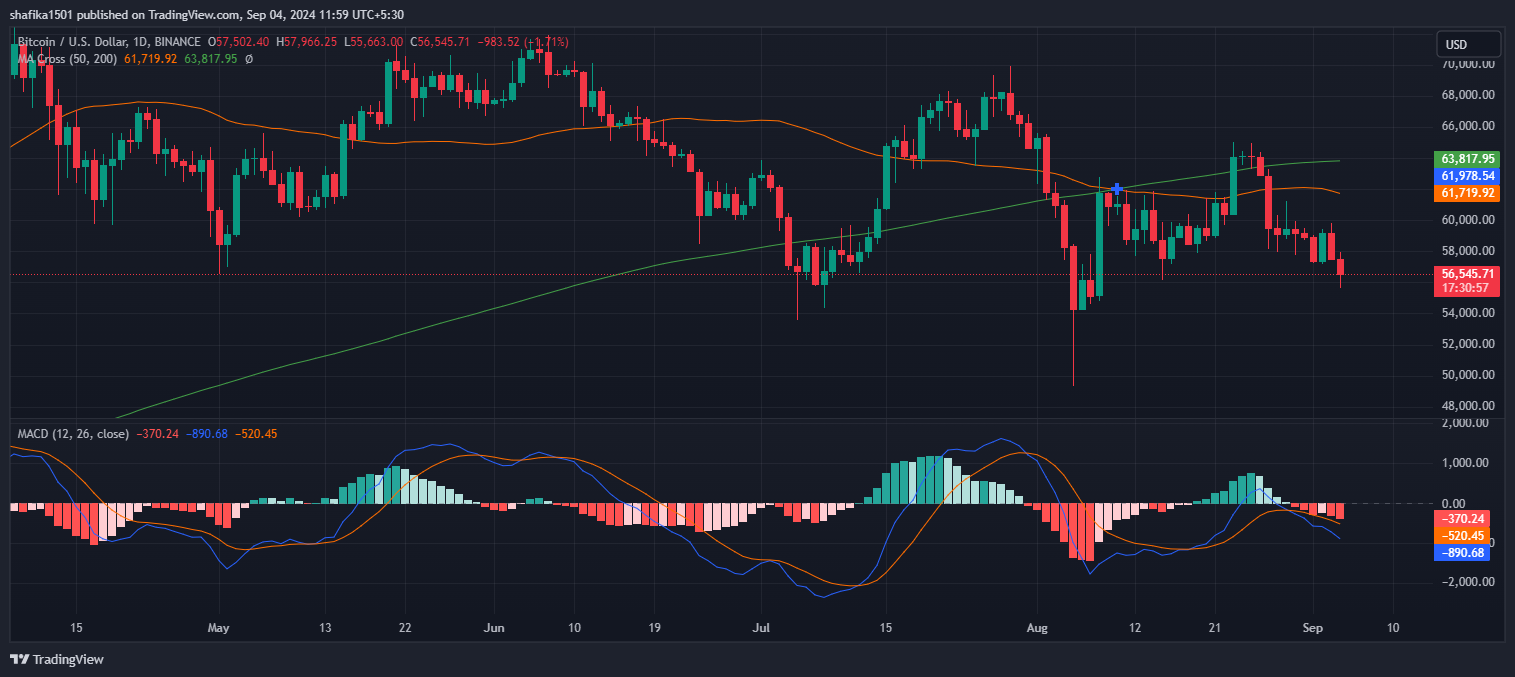
On inferring technical indicators data on Bitcoin’s daily price chart, the cryptocurrency’s price saw a death crossover on August 10 in the 50-day and 200-day MA. This bearish indication is further highlighted by the Moving Average Convergence and Divergence (MACD) indicator.
 BTC/
BTC/In the above chart, the signal line stands below the MACD line suggesting the current bearish trend. Moreover, BTC showed $53.82 million in 24-hour liquidations as per coinglass data . The token’s RSI stands at 39.60 showing the market selloffs as per TradingView data.
Furthermore, market analyst Ali popularly known as @ali_charts in the past few days stated that short-term BTC HODLers have shown selling activity since mid-August.