
Bitcoin Price Faces Crucial Test, Indicators Suggest Many Roadblocks To Recovery
Bitcoin price dived toward the $38,500 support zone. BTC is attempting a recovery wave and might struggle to climb above the $40,500 resistance.
- Bitcoin price extended its decline and tested the $38,500 support zone.
- The price is trading below $40,000 and the 100 hourly Simple moving average.
- There is a key bearish trend line forming with resistance near $40,450 on the hourly chart of the BTC/USD pair (data feed from Kraken).
- The pair might struggle to recover above the $40,000 and $40,500 resistance levels.
Bitcoin Price Turns Red
Bitcoin price remained in a bearish zone below the $40,000 support zone. BTC extended its decline and traded below the $49,200 level. Finally, it tested the $38,500 support zone, as discussed in yesterday’s post .
A new weekly low was formed near $38,518 and the price is now correcting losses. It is slowly recovering above the $39,000 level. It cleared the 23.6% Fib retracement level of the downward move from the $42,260 swing high to the $38,518 low.
Bitcoin is now trading below $40,000 and the 100 hourly Simple moving average . Immediate resistance is near the $40,000 level. The first major resistance is near the $40,350 level or the 50% Fib retracement level of the downward move from the $42,260 swing high to the $38,518 low.
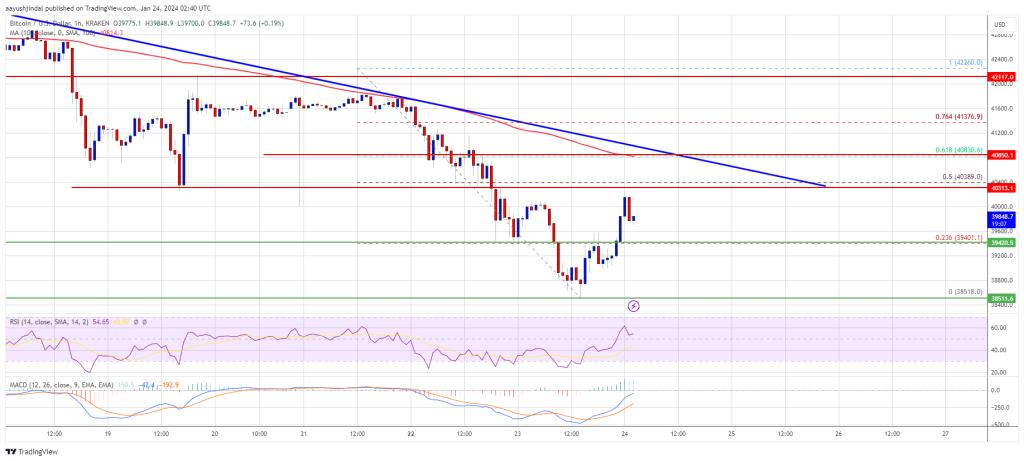
Source: BTCUSD on TradingView.com
There is also a key bearish trend line forming with resistance near $40,450 on the hourly chart of the BTC/USD pair. A clear move above the $40,450 resistance could send the price toward the $40,850 resistance. The next resistance is now forming near the $41,250 level. A close above the $41,250 level could push the price further higher. The next major resistance sits at $42,000.
Another Decline In BTC?
If Bitcoin fails to rise above the $40,450 resistance zone, it could start another decline. Immediate support on the downside is near the $39,400 level.
The next major support is $39,000. If there is a close below $39,000, the price could gain bearish momentum. In the stated case, the price could revisit the $38,500 support in the near term.
Technical indicators:
Hourly MACD – The MACD is now losing pace in the bearish zone.
Hourly RSI (Relative Strength Index) – The RSI for BTC/USD is now above the 50 level.
Major Support Levels – $39,400, followed by $38,500.
Major Resistance Levels – $40,350, $40,450, and $40,850.
Disclaimer: The content of this article solely reflects the author's opinion and does not represent the platform in any capacity. This article is not intended to serve as a reference for making investment decisions.
You may also like
BTC Volatility Weekly Review (November 17 - December 1)
Key metrics (from 4:00 PM HKT on November 17 to 4:00 PM HKT on December 1): BTC/USD: -9.6% (...

When all GameFi tokens have dropped out of the TOP 100, can COC reignite the narrative with a Bitcoin economic model?
On November 27, $COC mining will be launched. The opportunity to mine the first block won't wait for anyone.
Ethereum's Next Decade: From "Verifiable Computer" to "Internet Property Rights"
Fede, the founder of LambdaClass, provides an in-depth explanation of anti-fragility, the 1 Gigagas scaling goal, and the vision for Lean Ethereum.

The reason behind the global risk asset "Tuesday rebound": a "major change" at asset management giant Vanguard Group
This conservative giant, which had previously firmly resisted crypto assets, has finally compromised and officially opened bitcoin ETF trading access to its 8 million clients.
