XRP Bears Eye $0.48 as the Wors Might Not be Over Yet: Ripple Price Analysis

The recent market movements have subjected Ripple’s price to increased selling pressure, precipitating a descent below the significant 100-day and 200-day moving averages and concluding a pullback.
Despite this, indications point toward a sustained downward trajectory in the mid-term.
XRP Analysis
By Shayan
Ripple Price Analysis: The Daily Chart
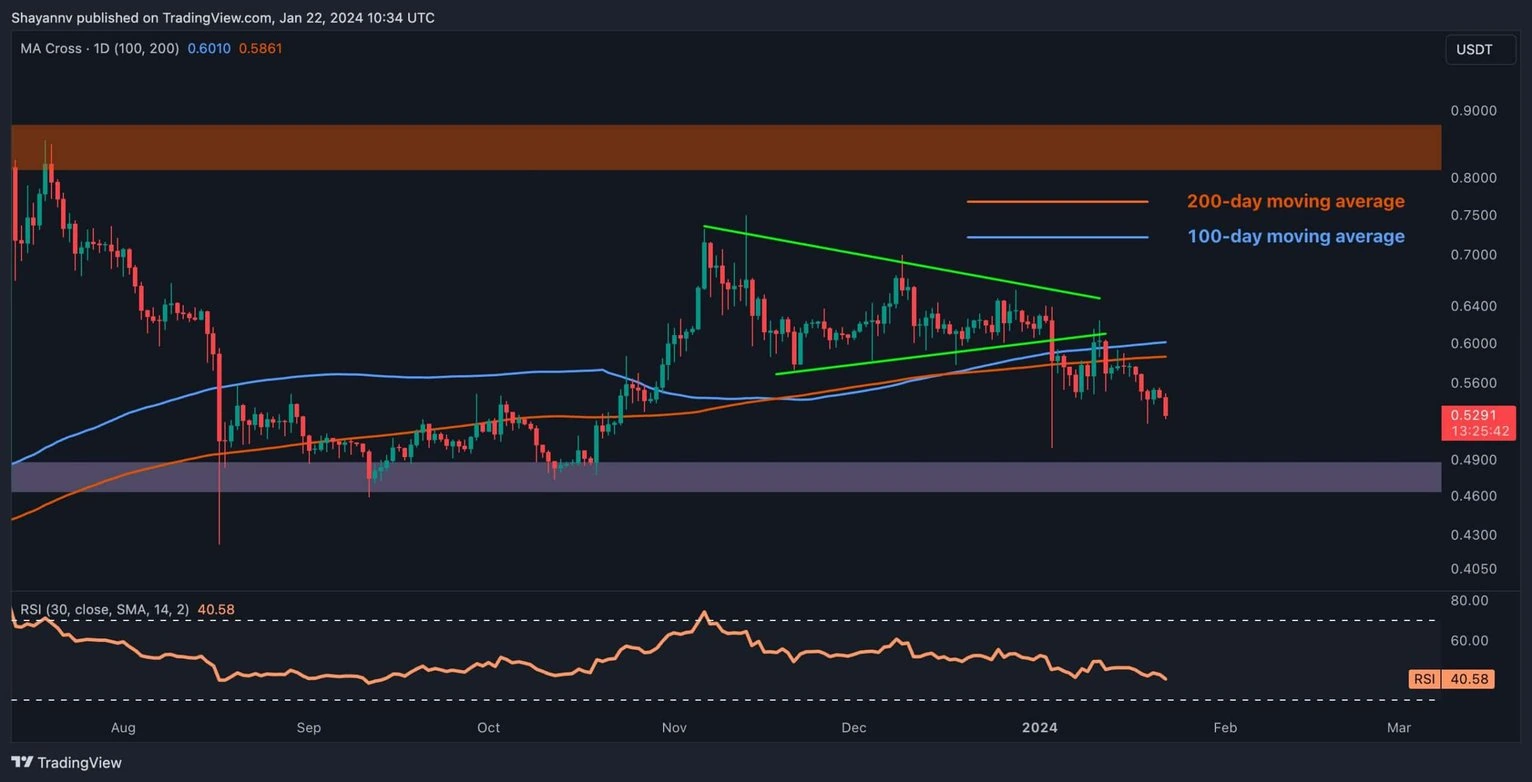
A thorough examination of the daily chart unveils a notable decline in Ripple’s price, breaching its multi-month sideways consolidation range and successfully completing a pullback. Intensified selling pressure also led to the breaking of a substantial support zone, encompassing the 100 and 200-day moving averages, prompting concerns about Ripple’s mid-term direction.
Considering the prevailing price action and market conditions, the likelihood of the recent descent persisting is high, with the aim of breaching the significant multi-month support region at $0.48. A successful break below this critical range could potentially set Ripple on a prolonged downward trajectory, instigating fear and uncertainty in the market.
The 4-Hour Chart
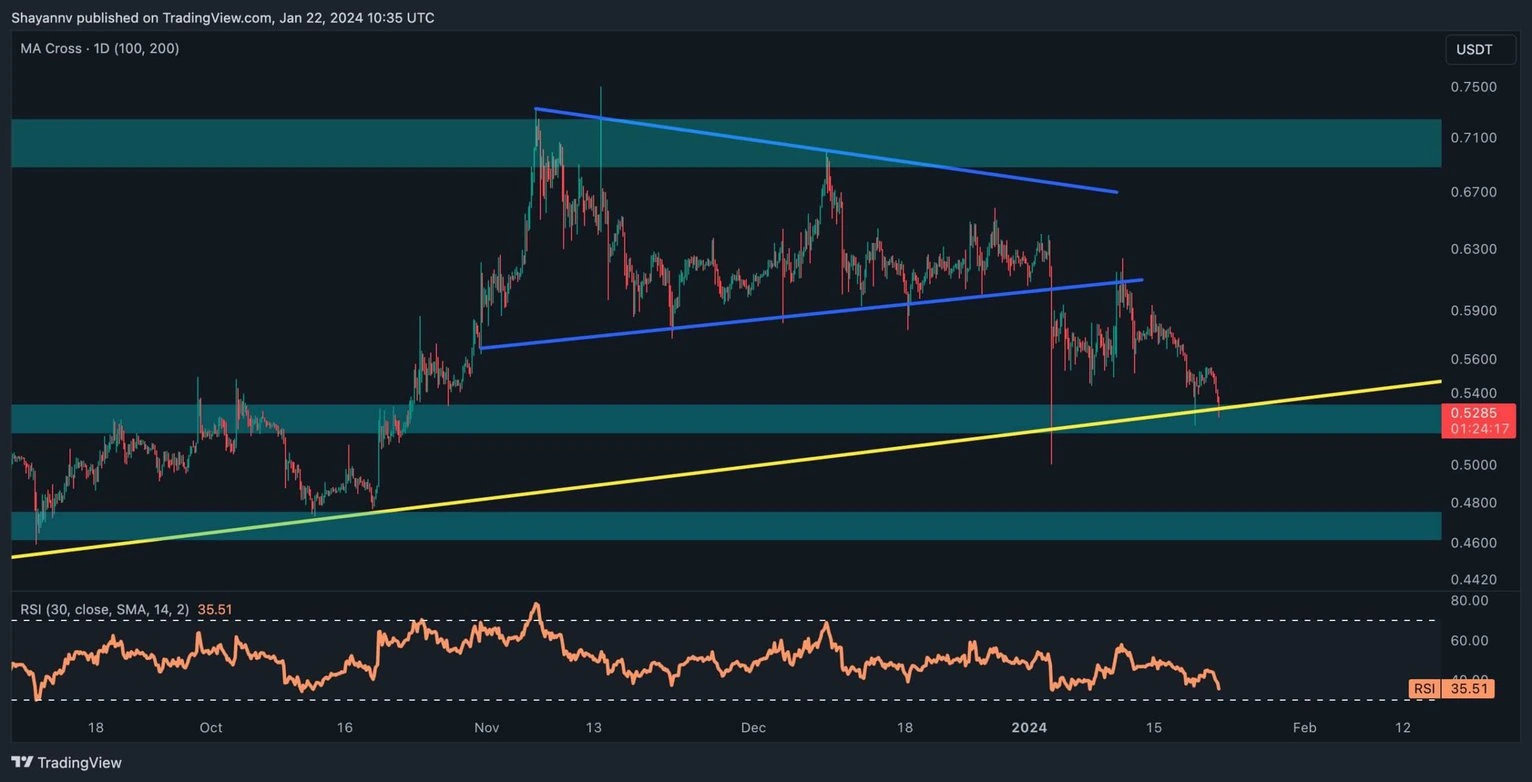
A closer analysis of the 4-hour chart reveals an impulsive breach below the lower boundary of the multi-week sideways wedge, underscoring the dominance of sellers in the market. However, the price has reached a pivotal support region determined by the multi-month ascending trendline.
This trendline has proven to be a robust support, halting multiple downward attempts. Presently, as the price intersects this crucial trendline and the static support zone at $0.52, there is a notable potential for a reversal, leading to a sideways consolidation phase.
Nonetheless, given the prevailing strength of sellers in the current market conditions, the possibility of a break below this crucial support region persists, potentially prolonging the ongoing downward trend. In such a scenario, the next critical support level for the price would be at $0.48.
Disclaimer: The content of this article solely reflects the author's opinion and does not represent the platform in any capacity. This article is not intended to serve as a reference for making investment decisions.
You may also like
Bitcoin plunges 30%. Has it really entered a bear market? A comprehensive assessment using 5 analytical frameworks
Further correction, with a dip to 70,000, has a probability of 15%; continued consolidation with fluctuations, using time to replace space, has a probability of 50%.

Data Insight: Bitcoin's Year-to-Date Gains Turn Negative, Is a Full Bear Market Really Here?
Spot demand remains weak, outflows from US spot ETFs are intensifying, and there has been no new buying from traditional financial allocators.
Why can Bitcoin support a trillion-dollar market cap?
The only way to access the services provided by bitcoin is to purchase the asset itself.
Crypto Has Until 2028 to Avoid a Quantum Collapse, Warns Vitalik Buterin